| 16 Elements of Cardiac Function
|
| ELECTRICAL PROPERTIES OF THE HEART
|
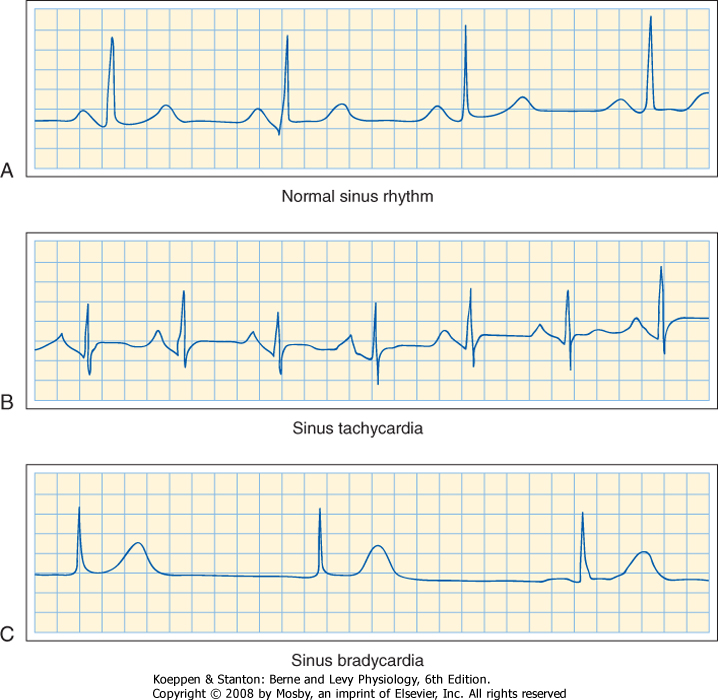
| The cells of the heart, like neurons, are excitable and generate action potentials. These action potentials initiate contraction and thus determine the heart rate. Disorders in electrical activity can induce serious and sometimes lethal disturbances in cardiac rhythm.
|
| In this section the electrical properties of cardiac cells are described. In addition, how these electrical properties account for the electrocardiogram (ECG) is considered. The initiation of contraction as a result of the electrical properties of cardiac cells is considered in a later section.
|
| The Cardiac Action Potential
|
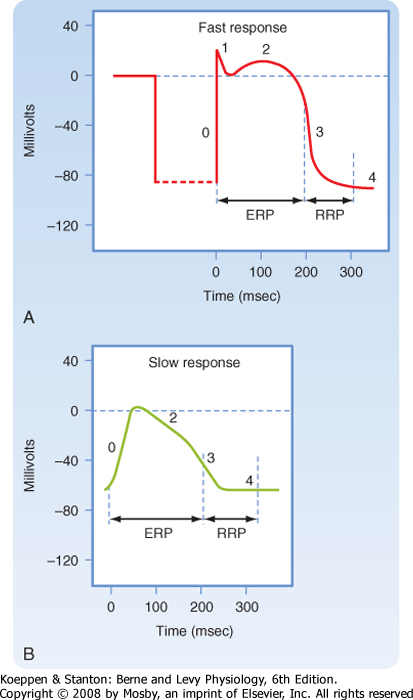
| Figure 16-1 illustrates action potentials found in different cardiac cells. Two main types of action potentials occur in the heart and are shown. One type, the fast response, occurs in normal atrial and ventricular myocytes and in the specialized conducting fibers (Purkinje fibers of the heart) and is divided into five phases. The rapid upstroke of the action potential is designated phase 0. The upstroke is followed by a brief period of partial, early repolarization (phase 1) and then by a plateau (phase 2) that persists for about 0.1 to 0.2 second. The membrane then repolarizes (phase 3) until the resting state of polarization (phase 4) is again attained (at point e). Final repolarization (phase 3) develops more slowly than depolarization (phase 0). The other type of action potential, the slow response, occurs in the sinoatrial (SA) node, which is the natural pacemaker region of the heart, and in the atrioventricular (AV) node, which is the specialized tissue that conducts the cardiac impulse from the atria to the ventricles. The slow-response cells lack the early repolarization phase (phase 1). Other differences between the electrical properties of the fast-response and slow-response cells include the following. The resting membrane potential (phase 4) of the fast-response cells is considerably more negative than that of the slow-response cells. Moreover, the slope of the upstroke (phase 0), the amplitude of the action potential, and the overshoot are greater in the fast-response than in the slow-response cells. The action potential amplitude and the steepness of the upstroke are important determinants of propagation velocity along the myocardial fibers. In slow-response cardiac tissue, the action potential is propagated more slowly and conduction is more likely to be blocked than in fast-response cardiac tissue. Slow conduction and a tendency toward conduction block increase the likelihood of some rhythm disturbances (see the section Reentry).
|
| As noted, the action potential initiates contraction of the myocyte. The relationships between the action potential and contraction of cardiac muscle are shown in Figure 16-2. Rapid depolarization (phase 0) precedes the development of force, and completion of repolarization coincides approximately with peak force. Relaxation of the muscle takes place mainly during phase 4 of the action potential. The duration of contraction usually parallels the duration of the action potential.
|
| The various phases of the cardiac action potential are associated with changes in cell membrane permeability, mainly to Na+, K+, and Ca++ ions. Changes in cell membrane permeability alter the rate of movement of these ions across the membrane and thereby change the membrane voltage (Vm). These changes in permeability are accomplished by the opening and closing of ion channels that are specific for individual ions (see Chapters 1 and 2).
|
| As with all other cells in the body, the concentration of K+ inside a cardiac muscle cell ([K+]i) exceeds the concentration outside the cell ([K+]o). The reverse concentration gradient exists for Na+ and Ca++. Estimates of the extracellular and intracellular concentrations of Na+, K+, and Ca++ and the Nernst equilibrium potentials (see Chapter 1) for these ions are compiled in Table 16-1.
|
| The resting cell membrane has relatively high permeability to K+; permeability to Na+ and Ca++ is much less. Given the existing chemical gradient for K+ and Vm, K+ tends to diffuse from the inside to the outside of the cell. Any flux of K+ that occurs at the resting membrane potential (i.e., during phase 4) takes place mainly through specific K+ channels. Several types of K+ channels exist in cardiac cell membranes. Opening and closing of some of these channels are regulated by Vm, whereas others are controlled by a chemical signal (e.g., the extracellular acetylcholine concentration). The specific K+ channel through which K+ passes during phase 4 is a voltage-regulated channel that conducts the inwardly rectifying K+ current. This current is symbolized IK1 and is discussed in more detail later. For now, it is necessary only to know how this current is established.
|
| page 292 |  | | page 293 |
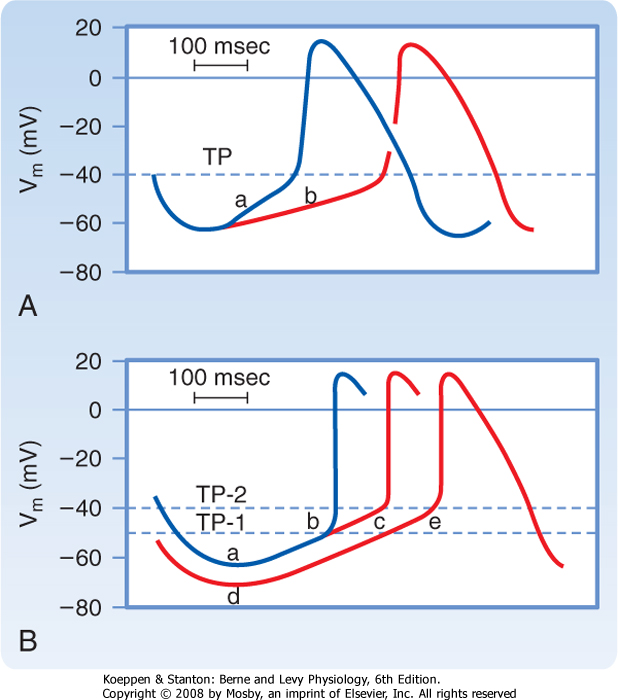
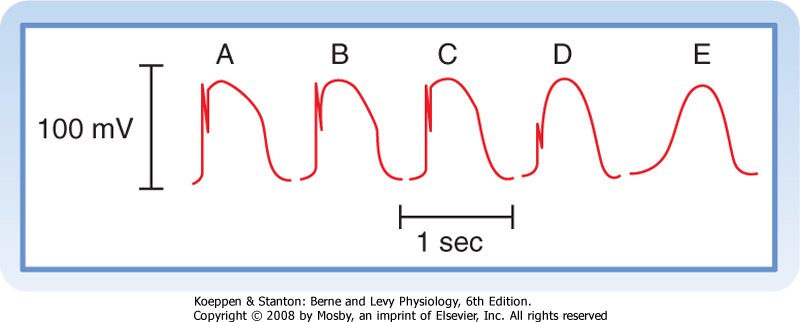
| Figure 16-1 Action potentials of fast-response (A) and slow-response (B) cardiac fibers. The phases of the action potentials are labeled (see text for details). The effective refractory period (ERP) and the relative refractory period (RRP) are labeled. Note that when compared with fast-response fibers, the resting potential of slow fibers is less negative, the upstroke (phase 0) of the action potential is less steep, the amplitude of the action potential is smaller, phase 1 is absent, and the RRP extends well into phase 4 after the fibers have fully repolarized. |
| Fast responses may change to slow responses under certain pathological conditions. For example, in coronary artery disease, a region of cardiac muscle may be deprived of its normal blood supply. As a result, [K+] in the interstitial fluid that surrounds the affected muscle cells rises because K+ is lost from the inadequately perfused (or ischemic) cells. The action potentials in some of these cells may then be converted from fast to slow responses. Conversion from a fast to a slow response as a result of increasing interstitial [K+] is illustrated later in Figure 16-13. |
| Figure 16-2 Time relationships between the force developed and changes in transmembrane potential in a thin strip of ventricular muscle. (Redrawn from Kavaler F et al: Bull NY Acad Med 41:5925, 1965.) |
|
Table 16-1.
Intracellular and Extracellular Ion Concentrations and Equilibrium Potentials in Cardiac Muscle Cells |
| Ion | Extracellular Concentrations (mM) | Intracellular Concentrations (mM)* | Equilibrium Potential (mV) |
| Na+ | 145 | 10 | 70 |
| K+ | 4 | 135 | -94 |
| Ca++ | 2 | 10-4 | 132 |
|
*The intracellular concentrations are estimates of the free concentrations in cytoplasm.
Data from Ten Eick RE et al: Prog Cardiovasc Dis 24:157, 1981.
|
| The dependence of Vm on conductance and the intracellular and extracellular concentrations of K+, Na+, and other ions is described by the chord
conductance equation (see Chapter 2). In a resting cardiac cell, conductance to K+ (gK) is about 100 times greater than conductance to Na+ (gNa). Therefore, Vm is similar to the Nernst equilibrium potential for K+. As a result, alterations in extracellular [K+] can significantly change Vm, with hypokalemia causing hyperpolarization and hyperkalemia causing depolarization. In contrast, because gNa is so small in the resting cell, changes in [Na+]o do not significantly affect Vm.
|
| Fast-Response Action Potentials
|
| Genesis of the Upstroke (Phase 0)
|
| Any stimulus that abruptly depolarizes Vm to a critical value (called the threshold) elicits an action potential. The characteristics of fast-response action potentials are shown in Figure 16-1, A. The rapid depolarization (phase 0) is related almost exclusively to the influx of Na+ into the myocyte as a result of a sudden increase in gNa. The action potential amplitude (the potential change during phase 0) is dependent on [Na+]o. When [Na+]o is decreased, the amplitude of the action potential decreases, and when [Na+]o is reduced from its normal value of about 140 mEq/L to about 20 mEq/L, the cell is no longer excitable.
|
| page 293 | | | page 294 |
| When the resting membrane potential, Vm, is suddenly depolarized from -90 mV to the threshold level
of about -65 mV, the cell membrane properties change dramatically. Na+ enters the myocyte through specific fast voltage-activated Na+ channels that exist in the membrane. These channels can be blocked by the puffer fish toxin tetrodotoxin. In addition, many drugs used to treat certain cardiac rhythm disturbances (cardiac arrhythmias) act by blocking these fast Na+ channels.
|

|
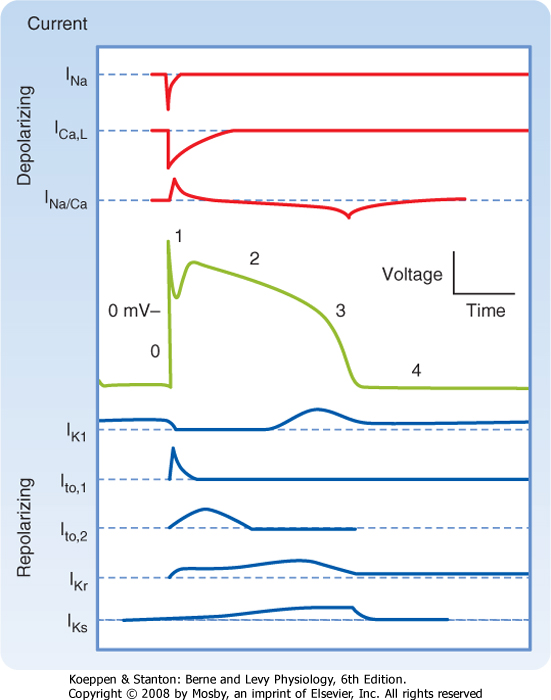
| Figure 16-3 Principal ionic currents and channels that generate the various phases of the action potential in a cardiac cell. Phase 0: The chemical and electrostatic forces both favor the entry of Na+ into the cell through fast Na+ channels to generate the upstroke. Phase 1: The chemical and electrostatic forces both favor the efflux of K+ through ito channels to generate early, partial repolarization. Phase 2: During the plateau, the net influx of Ca++ through Ca++ channels is balanced by the efflux of K+ through iK, iK1, and ito channels. Phase 3: The chemical forces that favor the efflux of K+ through iK, iK1, and ito channels predominate over the electrostatic forces that favor the influx of K+ through these same channels. Phase 4: The chemical forces that favor the efflux of K+ through iK and iK1 channels very slightly exceed the electrostatic forces that favor the influx of K+ through these same channels. |
| The Na+ channels open very rapidly or activate (in about 0.1 msec), thereby resulting in an abrupt increase in gNa. However, once open, the Na+ channels inactivate (time course ≈1 to 2 msec), and gNa rapidly decreases (Fig. 16-3). The Na+ channels remain in the inactivated state until the membrane begins to repolarize. With repolarization, the channel transitions to the closed state, from which it can then be reopened by another depolarization of Vm to the threshold. These properties of the Na+ channel underlie the basis of the action potential refractory period. When the Na+ channels are in the inactivated state, they cannot be reopened, and another action potential cannot be generated. During this period the cell is said to be in the effective refractory period. This prevents a sustained, tetanic contraction of cardiac muscle, which would retard ventricular relaxation and therefore interfere with the normal intermittent pumping action of the heart. As the cell repolarizes (phase 3), the inactivated
channels begin to transition to the closed state. During this period, called the relative refractory period, another action potential can be generated, but it requires a larger than normal depolarization of Vm. Only when Vm has returned to the resting level (phase 4) are all the Na+ channels closed and thus able to be reactivated by the normal depolarization of Vm.
|
| page 294 | | | page 295 |
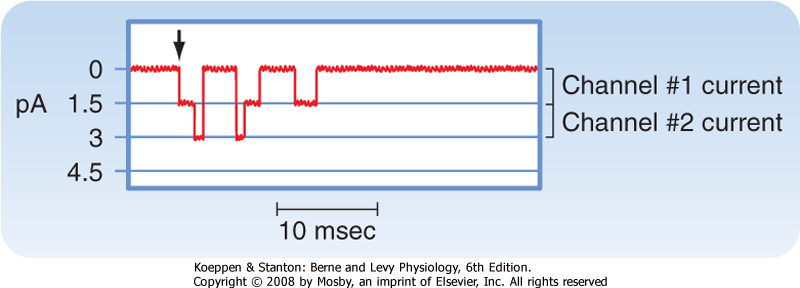
| Ionic currents through single membrane channels can be measured with the patch clamp technique. The individual channels open and close repeatedly in a random manner. This process is illustrated in Figure 16-4, which shows the current flow through single Na+ channels in a myocardial cell. To the left of the arrow, the membrane potential was clamped at -85 mV. At the arrow, the potential was suddenly changed to -45 mV, at which value it was held for the remainder of the record. Figure 16-4 indicates that immediately after the membrane potential was made less negative, one Na+ channel opened three times in sequence. It remained open for about 2 or 3 msec each time and closed for about 4 or 5 msec between openings. In the open state it allowed 1.5 pA of current to pass. During the first
and second openings of this channel, a second channel also opened, but for periods of only 1 msec. During the brief times that both channels were open simultaneously, the total current was 3 pA. After the first channel closed for the third time, both channels remained closed for the rest of the recording, even though the membrane was held constant at -45 mV. |
| The overall change in ionic conductance of the entire cell membrane at any given time reflects the number of channels that are open at that time. Because the individual channels open and close randomly, the overall membrane conductance represents the statistical probability of the open or closed state of the individual channels. The temporal characteristics of the activation process then represent the time course of the increasing probability that the specific channels will be open rather than the kinetic characteristics of the activation gates in the individual channels. Similarly, the temporal characteristics of inactivation reflect the time course of the decreasing probability that the channels will be open and not the kinetic characteristics of the inactivation gates in the individual channels. |
|
|
| Figure 16-4 Current (in picoamperes) through two individual Na+ channels in a cultured heart cell recorded with the patch clamp technique. Membrane voltage was held at -85 mV and then abruptly changed to -45 mV at the arrow and held at this potential for the remainder of the record. (Redrawn from Cachelin AB et al: J Physiol 340:389, 1983.) |
| Genesis of Early Repolarization (Phase 1)
|
| In many cardiac cells that have a prominent plateau, phase 1 is an early, brief period of limited repolarization. This brief repolarization results in the notch between the end of the upstroke and the beginning of the plateau (Figs. 16-1 and 16-3). Repolarization is brief because of activation of a transient outward current (ito) carried mainly by K+. Activation of K+ channels during phase 1 causes a brief efflux of K+ from the cell because the cell interior is positively charged and [K+]i greatly exceeds [K+]o (Fig. 16-3). The cell is briefly and partially repolarized as a result of this transient efflux of K+.
|
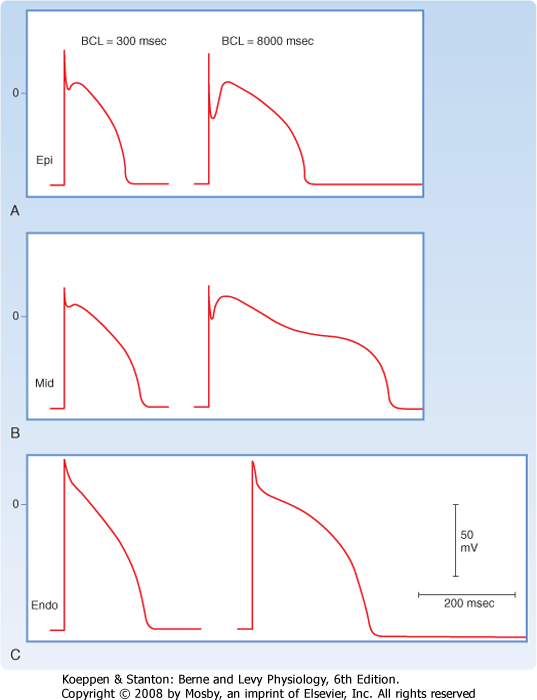
| The size of the phase 1 notch varies among cardiac cells. It is prominent in myocytes in the epicardial and midmyocardial regions of the left ventricular wall (Fig. 16-5) and in ventricular Purkinje fibers. However, the notch is negligible in myocytes from the endocardial region of the left ventricle (Fig. 16-5) because the density of ito channels is less in these cells. The notch is also less prominent in the presence of 4-aminopyridine, which blocks the K+ channels that carry ito.
|
| Genesis of the Plateau (Phase 2)
|
| During the action potential plateau, Ca++ enters myocardial cells through calcium channels (see later) that activate and inactivate much more slowly than the fast Na+ channels do. During the flat portion of phase 2 (Figs. 16-1 and 16-3), this influx of Ca++ is counterbalanced by the efflux of K+. K+ exits through channels that conduct mainly the ito, iK, and iK1 currents. The ito current is responsible for phase 1, as described previously, but it is not completely inactivated until after phase 2 has expired. The iK and iK1 currents are described later in this chapter.
|
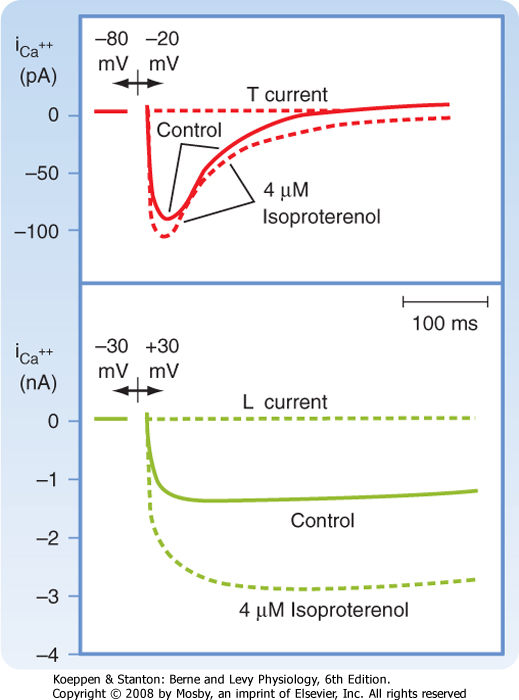
| Ca++ enters the cell via voltage-regulated Ca++ channels, which are activated as Vm becomes progressively less negative during the action potential upstroke. Two types of Ca++ channels (L type and T type) have been identified in cardiac tissue. Some of their important characteristics are illustrated in Figure 16-6. L-type channels are so designated because once open they inactivate slowly (Fig. 16-6, lower panel) and provide a "long-lasting" Ca++ current. They are the predominant type of Ca++ channel in the heart, and they are activated during the action potential upstroke when Vm reaches about -20 mV. L-type channels are blocked by Ca++ channel antagonists such as verapamil, amlodipine, and diltiazem (Fig. 16-7).
|
| T-type (or "transient") Ca++ channels are much less abundant in the heart. They are activated at more negative potentials (about -70 mV) than L-type channels are. They also inactivate more quickly than L-type channels do (Fig. 16-6, upper panel).
|
| Because L-type channels are the most abundant, the following is focused on their function and properties. Opening of Ca++ channels results in an increase in Ca++ conductance (gCa) and current (iCa) soon after the action potential upstroke (Fig. 16-3). Because [Ca++]i is much less than [Ca++]o (Table 16-1), the increase in gCa promotes the influx of Ca++ into the cell throughout the plateau. This Ca++ influx during the plateau is involved in excitation-contraction coupling, as described later (see also Chapter 13).
|
| Various neurotransmitters and drugs may substantially influence gCa. The adrenergic neurotransmitter norepinephrine, the β-adrenergic receptor agonist isoproterenol, and various other catecholamines enhance gCa, whereas the parasympathetic neurotransmitter acetylcholine decreases gCa. Enhancement of gCa by catecholamines is the principal mechanism by which they enhance cardiac muscle contractility.
|
| page 295 | | | page 296 |
| Figure 16-5 Action potentials recorded from the epicardial (A), midmyocardial (B), and endocardial (C) regions of the free wall of the canine left ventricle. The preparations were driven at a basic cycle length (BCL) of 300 and 8000 msec. (From Liu D-W et al: Circ Res 72:671, 1993.) |
| To enhance gCa, catecholamines first bind to β-adrenergic receptors in the cardiac cell membrane. This interaction stimulates the membrane-bound enzyme adenylyl cyclase, which raises the intracellular concentration of cAMP (see also Chapter 3). The rise in the level of cAMP activates cAMP-dependent protein kinase, which in turn promotes phosphorylation of the L-type Ca++ channels in the cell membrane and thus augments the influx of Ca++ into the cells (Fig. 16-6). Conversely, acetylcholine interacts with muscarinic receptors in the cell membrane to inhibit adenylyl cyclase. In this way, acetylcholine antagonizes the activation of Ca++ channels and thereby diminishes gCa. |
|
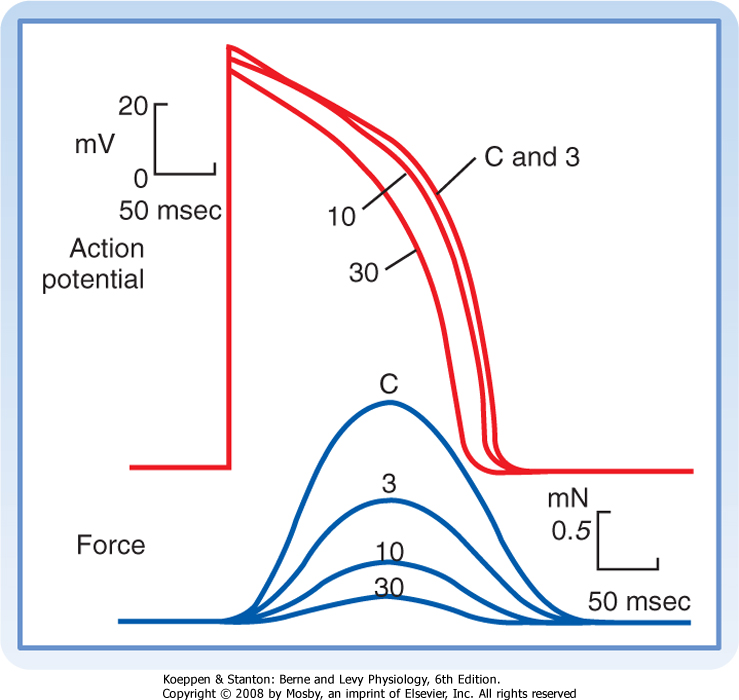
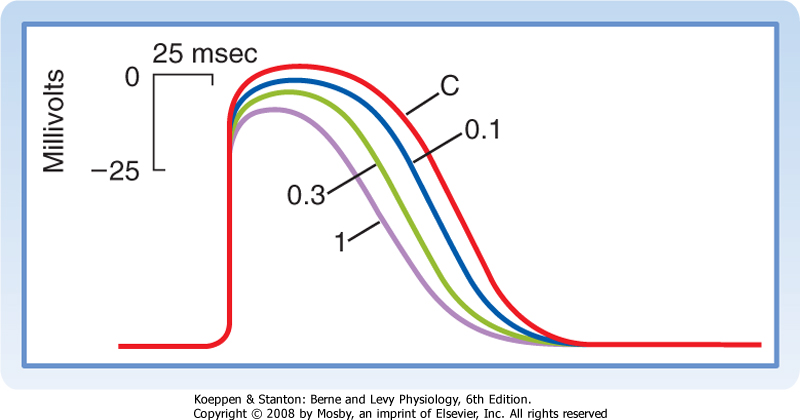
| Ca++ channel antagonists are substances that block Ca++ channels. Examples include the drugs verapamil, amlodipine, and diltiazem. These drugs decrease gCa and thereby impede the influx of Ca++ into myocardial cells. Ca++ channel antagonists decrease the duration of the action potential plateau and diminish the strength of the cardiac contraction (Fig. 16-7). Ca++ channel antagonists also depress the contraction of vascular smooth muscle and thereby induce generalized vasodilation. This diminished vascular resistance reduces the counterforce (afterload) that opposes the propulsion of blood from the ventricles into the arterial system, as explained in Chapter 17. Hence, vasodilator drugs such as the Ca++ channel antagonists are often referred to as afterload-reducing drugs. |
| page 296 | | | page 297 |
| Figure 16-6 Effects of isoproterenol on the Ca++ currents conducted by T-type (upper panel) and L-type (lower panel) Ca++ channels in atrial myocytes. Upper panel, potential changed from -80 to -20 mV; lower panel, potential changed from -30 to +30 mV. (Redrawn from Bean BP: J Gen Physiol 86:1, 1985.) |
| Figure 16-7 Effects of diltiazem, a Ca++ channel antagonist, on the action potentials (in millivolts) and isometric contractile forces (in millinewtons) recorded from an isolated papillary muscle. The tracings were recorded under control conditions (C) and in the presence of diltiazem in concentrations of 3, 10, and 30 μmol/L. (Redrawn from Hirth C et al: J Mol Cell Cardiol 15:799, 1983.) |
| Figure 16-8 Changes in depolarizing (upper panels) and repolarizing ion currents during the various phases of the action potential in a fast-response cardiac ventricular cell. The inward currents include the fast Na+ and L-type Ca++ currents. Outward currents are iK1, ito, and the rapid (iKr) and slow (iKs) delayed rectifier K+ currents. (Redrawn from Tomaselli G, Marbán E: Cardiovasc Res 42:270, 1999.) |
| During the plateau (phase 2) of the action potential, the concentration gradient for K+ across the cell membrane is virtually the same as it is during phase 4. However, Vm is now positive. Therefore, there is a large gradient that favors efflux of K+ from the cell (Fig. 16-3). If gK were the same during the plateau as it is during phase 4, efflux of K+ during phase 2 would greatly exceed the influx of Ca++, and a sustained plateau could not be achieved. However, as Vm approaches and then attains positive values near the peak of the action potential upstroke, gK suddenly
decreases (Fig. 16-8). The diminished K+ current associated with the reduction in gK prevents excessive loss of K+ from the cell during the plateau.
|
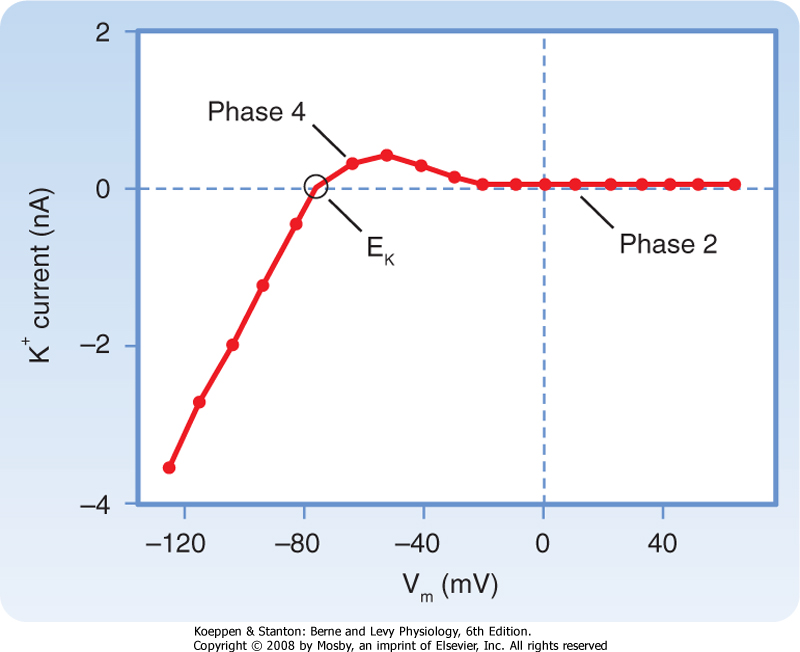
| This reduction in gK at both positive and low negative values of Vm is called inward rectification. Inward rectification is a characteristic of several K+ currents, including the iK1 current (Fig. 16-9). For these channels, large K+ currents flow at negative values of Vm (i.e., gK is large). However, when Vm is near 0 mV, or positive, as occurs during the plateau (phase 2), little or no K+ current flows (i.e., gK is low). Thus, the substantial gK that prevails during phase 4 of the cardiac action potential (Fig. 16-8) is largely due to the iK1 channels, but current through these channels is greatly diminished during the plateau (Fig. 16-9).
|
| page 297 | | | page 298 |
| Figure 16-9 Inwardly rectified K+ currents recorded from a ventricular myocyte when the potential was changed from a holding potential of -80 mV to various test potentials. Positive values along the vertical axis represent outward currents; negative values represent inward currents. The Vm coordinate of the point (open circle) at which the curve intersects the x axis is the reversal potential; it denotes the Nernst equilibrium potential (EK), at which point the chemical and electrostatic forces are equal. (Redrawn from Giles WR, Imaizumi Y: J Physiol [Lond] 405:123, 1988.) |
| Other K+ channels play a role in phase 2 of the action potential. These are characterized as delayed rectifier (iK) channels. These K+ channels are closed during phase 4 and are activated very slowly by the potentials that prevail toward the end of phase 0. Hence, activation of these channels tends to increase gK very gradually during phase 2. These channels play only a minor role during phase 2, but they contribute to the process of final repolarization (phase 3), as described later. Two types of iK channels exist, depending on their rates of activation. The more slowly
activating channel is designated the iKs channel, whereas the more rapidly activating channel is designated the iKr channel (Fig. 16-8). The duration of the action potential in myocytes in various regions of the ventricular myocardium is determined in part by the relative distributions of these iKr and iKs channels.
|
| The action potential plateau persists as long as the efflux of charge carried mainly by K+ is balanced by the influx of charge carried mainly by Ca++. The effects of altering this balance are demonstrated by the action of the Ca++ channel antagonist diltiazem in an isolated papillary muscle preparation (Fig. 16-7). With increasing concentrations of diltiazem, the plateau voltage becomes progressively less positive and the plateau duration diminishes. Conversely, administration of certain K+ channel antagonists prolongs the plateau substantially.
|
| Genesis of Final Repolarization (Phase 3)
|
| The process of final repolarization (phase 3) starts at the end of phase 2, when efflux of K+ from the cardiac cell begins to exceed influx of Ca++. As noted, at least three outward K+ currents (ito, iK, and iK1) contribute to the final repolarization (phase 3) of the cardiac cell (Figs. 16-3 and 16-8).
|
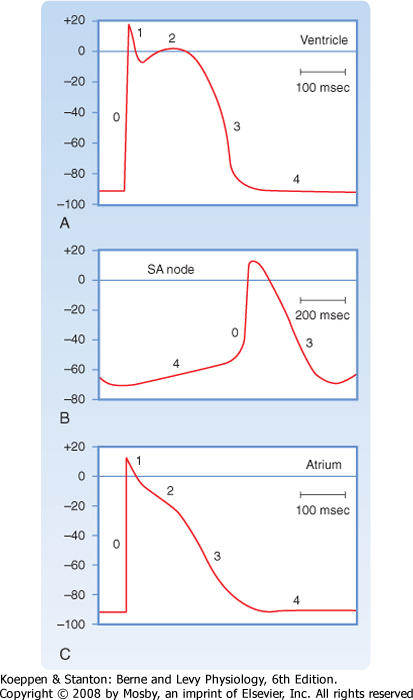
| Figure 16-10 Typical action potentials (in millivolts) recorded from cells in the ventricle (A), SA node (B), and atrium (C). Note that the time calibration in B differs from that in A and C. (From Hoffman BF, Cranefield PF: Electrophysiology of the Heart. New York, McGraw-Hill, 1960.) |
| The transient outward (ito) and the delayed rectifier (iKr, iKs) currents help initiate repolarization. These currents are therefore important determinants of the duration of the plateau. For example, the duration of the plateau is substantially less in atrial than in ventricular myocytes (Fig. 16-10) because the magnitude of ito during the plateau is greater in atrial than in ventricular myocytes. As already noted, the duration
of the action potential in ventricular myocytes varies considerably with the location of these myocytes in the ventricular walls (Fig. 16-5). The ito and delayed rectifier (iK) currents mainly account for these differences. In endocardial myocytes, in which the duration of the action potential is least, the magnitude of iK is greatest. The converse applies to the midmyocardial myocytes. The magnitude of iK and the duration of the action potential are intermediate for epicardial myocytes.
|
| page 298 | | | page 299 |
| The inwardly rectified K+ current iK1 does not participate in the initiation of repolarization because the conductance of these channels is very small over the range of Vm values that prevail during the plateau. However, the iK1 channels contribute substantially to the rate of repolarization once phase 3 has been
initiated. As Vm becomes increasingly negative during phase 3, the conductance of the channels that carry the iK1 current progressively increases and thereby accelerates repolarization (Fig. 16-3).
|
| Restoration of Ionic Concentrations (Phase 4)
|
| The steady inward leak of Na+ that enters the cell rapidly during phase 0 and more slowly throughout the cardiac cycle would gradually depolarize the resting membrane voltage were it not for Na+,K+-ATPase, which is located in the cell membrane (see Chapter 1). Similarly, most of the excess Ca++ ions that had entered the cell mainly during phase 2 are eliminated principally by a 3Na+-1Ca++ antiporter, which exchanges 3 Na+ ions for 1 Ca++ ion. However, some of the Ca++ ions are eliminated by an ATP-driven Ca++ pump.
|
| Slow-Response Action Potentials
|
| As described earlier, fast-response action potentials (Fig. 16-1, A) consist of four principal components: an upstroke (phase 0), an early partial repolarization (phase 1), a plateau (phase 2), and a final repolarization (phase 3). However, in the slow-response action potential (Fig. 16-1, B), the upstroke is much less steep, early repolarization (phase 1) is absent, the plateau is less prolonged and not as flat, and the transition from the plateau to the final repolarization is less distinct.
|
| Blocking fast Na+ channels with tetrodotoxin in a fast-response fiber can generate slow responses under appropriate conditions. The Purkinje fiber action potential shown in Figure 16-11 clearly exhibits the two response types. In the control tracing (A), the typical fast-response action potential displays a prominent notch as a result of ito that separates the upstroke from the plateau. In action potentials B to E, progressively larger quantities of tetrodotoxin produce a graded blockade of the fast Na+ channels. The upstroke and notch become progressively less prominent in action potentials B to D. In action potential E, the notch has disappeared and the upstroke is very gradual; this action potential resembles a typical slow response.
|
|
| Figure 16-11 Effect of tetrodotoxin, which blocks the fast Na+ channels, on the action potentials recorded in a Purkinje fiber. The concentration of tetrodotoxin was 0 M in A, 3 × 10⁻⁸ M in B, 3 × 10⁻⁷ M in C, and 3 × 10⁻⁶ M in D and E; E was recorded later than D. (Redrawn from Carmeliet E, Vereecke J: Pflügers Arch 313:300, 1969.) |
| Certain cells in the heart, notably those in the SA and AV nodes, exhibit slow-response action potentials. In these cells, depolarization is achieved mainly
by influx of Ca++ through L-type Ca++ channels instead of influx of Na+ through fast Na+ channels. Repolarization is accomplished in these fibers by inactivation of the Ca++ channels and by the increased K+ conductance through the iK1 and iK channels (Fig. 16-3).
|
| CONDUCTION IN CARDIAC FIBERS
|
| An action potential traveling along a cardiac muscle fiber is propagated by local circuit currents, much as it is in nerve and skeletal muscle fibers (see Chapter 5). When the wave of depolarization reaches the end of the cell, the impulse is conducted to adjacent cells through gap junctions (see Chapter 2). Impulses pass more readily along the length of the cell (isotropic) than laterally from cell to cell (anisotropic) because gap junctions are preferentially located at the ends of the cell. These channels are rather nonselective in their permeability to ions and have a low electrical resistance that allows ionic current to pass from one cell to another. The electrical resistance of gap junctions is similar to that of cytoplasm. The flow of charge from cell to cell follows the principles of local circuit currents and therefore allows intercellular propagation of the impulse.
|
| Conduction of the Fast Response
|
| The characteristics of conduction differ in fast- and slow-response fibers. In fast-response fibers, fast Na+ channels are activated when the transmembrane potential of one region of the fiber suddenly changes from a resting value of about -90 mV to the threshold value of about -65 mV. The inward Na+ current then rapidly depolarizes the cell at that site. This portion of the fiber subsequently becomes part of the depolarized zone, and the border is displaced accordingly. The same process then begins at the new border. This process is repeated again and again, and the border moves continuously down the fiber as a wave of depolarization (Fig. 16-12).
|
| Figure 16-12 The role of local currents in the propagation of a wave of excitation down a cardiac fiber. |
| page 299 | | | page 300 |
| The conduction velocity along the fiber varies directly with the amplitude of the action potential and the rate of change of the potential (dVm/dt) during phase 0. The amplitude of the action potential equals the potential difference between the fully depolarized and the fully polarized regions of the cell interior. The
magnitude of the local current is proportional to this potential difference (see Chapter 5). Because these local currents shift the potential of the resting zone toward the threshold value, they are local stimuli that depolarize the adjacent resting portion of the fiber to its threshold potential. The greater the potential difference between the depolarized and polarized regions (i.e., the greater the action potential amplitude), the more effective are local stimuli in depolarizing adjacent parts of the membrane and the more rapidly is the wave of depolarization propagated down the fiber.
|
| The rate of change in potential during phase 0 is also an important determinant of conduction velocity. If the active portion of the fiber depolarizes gradually, the local currents between the resting region and the neighboring depolarizing region are small. The resting region adjacent to the active zone is depolarized gradually, and consequently more time is required for each new section of the fiber to reach threshold. This allows some Na+ channels to inactivate.
|
|
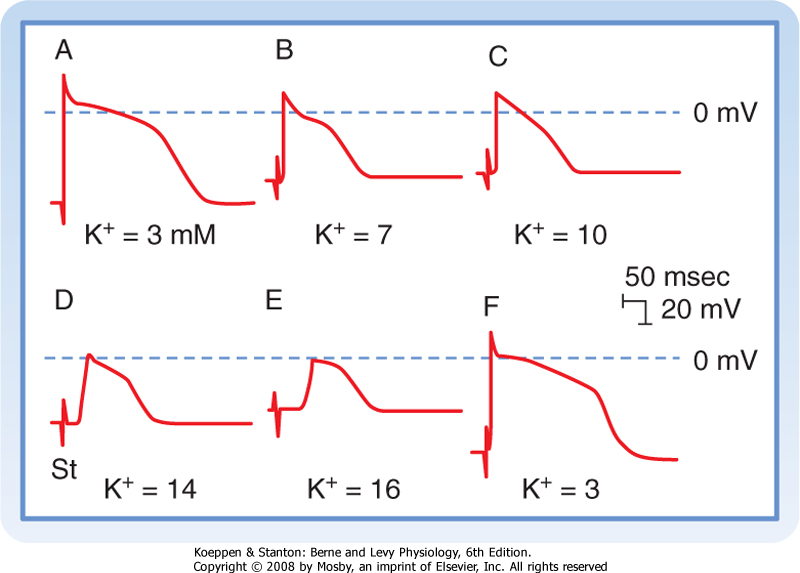
| Figure 16-13 Effect of changes in [K+]o on the transmembrane action potentials recorded from a Purkinje fiber. The stimulus artifact (St) appears as a biphasic spike to the left of the upstroke of the action potential. The horizontal lines near the peaks of the action potentials denote 0 mV. When [K+]o is 3 mM (A and F), the resting Vm is -82 mV and the slope of phase 0 is steep. At the end of phase 0, the overshoot attains a value of 30 mV. Hence, the action potential amplitude is 112 mV. The distance from the stimulus artifact to the beginning of phase 0 is inversely proportional to the conduction velocity. When [K+]o is increased gradually to 16 mM (B to E), the resting Vm becomes progressively less negative. At the same time, the amplitudes and durations of the action potentials and the steepness of the upstrokes all diminish. As a consequence, conduction velocity decreases progressively. At [K+]o levels of 14 and 16 mM (D and E), the resting Vm attains levels sufficient to inactivate all the fast Na+ channels and leave the characteristic slow-response action potentials. (From Myerburg RJ, Lazzara R: In Fisch E [ed]: Complex Electrocardiography. Philadelphia, FA Davis, 1973.) |
| The resting membrane potential is also an important determinant of conduction velocity. Changes in the resting membrane potential influence both the amplitude of the action potential and the slope of the upstroke, which in turn alter the conduction velocity (Fig. 16-13). Depolarization of Vm leads to inactivation
of the fast Na+ channels, which in turn decreases the amplitude of the action potential and the slope of the upstroke, and as a consequence conduction velocity is slowed. In addition to changes in [K+]o, premature excitation of a cell that has not completely repolarized will also result in a decrease in conduction velocity. This too reflects the fact that when Vm is depolarized, more fast Na+ channels are inactivated, and thus only a fraction of the Na+ channels are available to conduct the inward Na+ current during phase 0.
|
| Conduction of the Slow Response
|
| Most of the experimentally induced changes in transmembrane potential shown in Figure 16-13 also take place in the cardiac tissue of patients with coronary artery disease. When blood flow to a region of the myocardium is diminished, the supply of O2 and metabolic substrates delivered to the ischemic tissues is insufficient. The Na+,K+-ATPase in the membrane of cardiac myocytes requires considerable metabolic energy to maintain the normal transmembrane exchanges of Na+ and K+. When blood flow is inadequate, the activity of Na+,K+-ATPase is impaired, and the ischemic myocytes gain excess Na+ and lose K+ to the surrounding interstitial space. Consequently, [K+]o in the extracellular fluid surrounding the ischemic myocytes is elevated. Hence, the myocytes are affected by the elevated [K+]o in much the same way as the myocyte depicted in Figure 16-13. Such changes in [K+]o may disturb cardiac rhythm and conduction critically. |
|

|
| Figure 16-14 Changes in action potential amplitude and upstroke slope as action potentials are initiated at different stages of the relative refractory period of the preceding excitation. (Redrawn from Rosen MR et al: Am Heart J 88:380, 1974.) |
| page 300 | | | page 301 |
| Local circuits (Fig. 16-12) also propagate the slow response, the conduction characteristics of which differ quantitatively from those of the fast response. The threshold potential is about -40 mV for the slow response, and conduction is much slower than for the
fast response. The conduction velocities of the slow response in the SA and AV nodes are about 0.02 to 0.1 m/sec. The fast-response conduction velocities are about 0.3 to 1 m/sec for myocardial cells and 1 to 4 m/sec for the specialized conducting (Purkinje) fibers in the ventricles. Slow responses are more readily blocked than fast responses; that is, conduction ceases before the impulse reaches the end of the myocardial fiber. In addition, fast-response fibers can respond at repetition rates that are much greater than those of slow-response fibers.
|
| Because of the rapid development of artificial pacemakers and other electrical devices for correcting cardiac rhythm disturbances, detailed knowledge of cardiac excitability is essential. The excitability characteristics of various types of cardiac cells differ considerably, depending on whether the action potentials are fast or slow responses.
|
| Once the fast response has been initiated, the depolarized cell is no longer excitable until the cell has partially repolarized (Fig. 16-1, A). The interval from the beginning of the action potential until the fiber is able to conduct another action potential is called the effective refractory period. In the fast response, this period extends from the beginning of phase 0 to a point in phase 3 at which repolarization has reached about -50 mV (phase 3 in Fig. 16-1, A). At about this value of Vm, many of the fast Na+ channels have transitioned from the inactivated to the closed state. However, the cardiac fiber is not fully excitable until it has been completely repolarized. Before complete repolarization (i.e., during the relative refractory period), an action potential may be evoked only when the stimulus is stronger than a stimulus that could elicit a response during phase 4.
|
| When a fast response is evoked during the relative refractory period of a previous excitation, its characteristics vary with the membrane potential that exists at the time of stimulation (Fig. 16-14). The later in the relative refractory period that the fiber is stimulated, the greater the increase in the amplitude of the response and the slope of the upstroke because the number of fast Na+ channels that have recovered from inactivation increases as repolarization proceeds. As a consequence, propagation velocity also increases the later in the relative refractory period that the fiber is stimulated. Once the fiber is fully repolarized, the response is constant no matter what time in phase 4 the stimulus is applied.
|
| In slow-response fibers, the relative refractory period frequently extends well beyond phase 3 (Fig. 16-1, B). Even after the cell has completely repolarized, it may be difficult to evoke a propagated response for some time. This characteristic of slow-response fibers is called postrepolarization refractoriness.
|
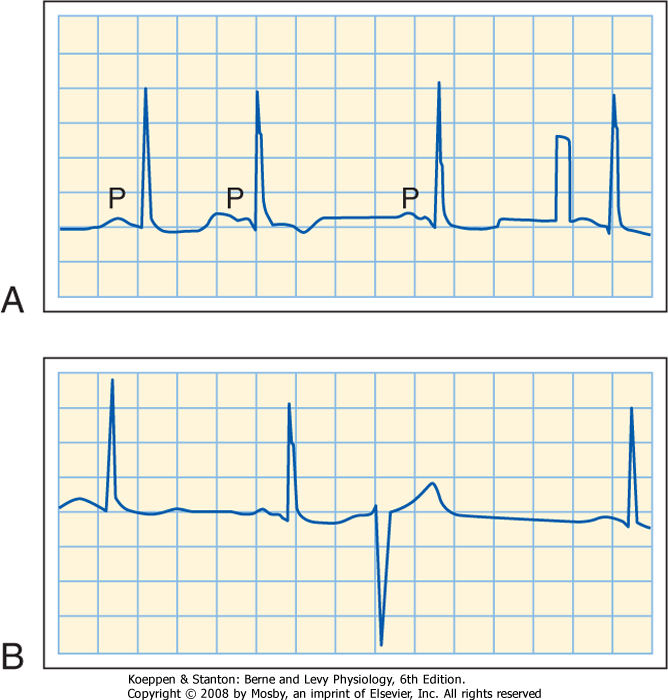
| In a patient who has occasional premature depolarizations (Fig. 16-32), the timing of these early beats may determine their clinical consequence. If they occur late in the relative refractory period of the preceding depolarization, or after full repolarization, the premature depolarization is probably inconsequential. However, if the premature depolarizations originate early in the relative refractory period of the ventricles, conduction of the premature impulse from the site of origin will be slow, and hence reentry is more likely to occur. If that reentry is irregular (i.e., if ventricular fibrillation ensues), the heart cannot pump effectively and death may result. |
|
|
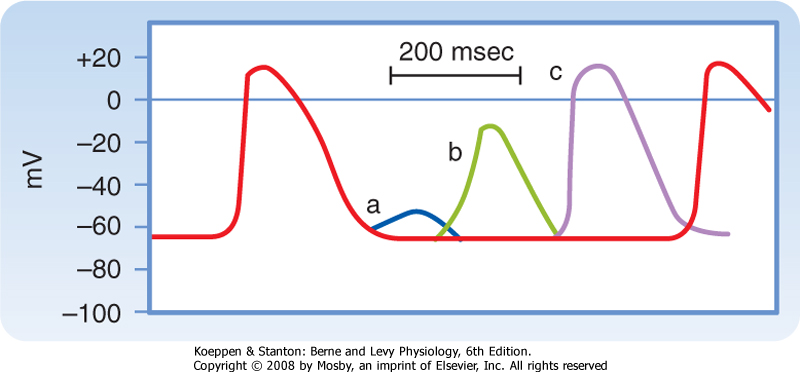
| Figure 16-15 Effects of excitation at various times after the initiation of an action potential in a slow-response fiber. In this fiber, excitation very late in phase 3 (or early in phase 4) induces a small, nonpropagated (local) response (a). Later in phase 4, a propagated response (b) can be elicited, but its amplitude is small and the upstroke is not very steep; this response is conducted very slowly. Still later in phase 4, full excitability is regained, and the response (c) displays normal characteristics. (Modified from Singer DH et al: Prog Cardiovasc Dis 24:97, 1981.) |
| Action potentials evoked early in the relative refractory period are small and the upstrokes are not very steep (Fig. 16-15). The amplitudes and upstroke slopes progressively improve as action potentials are elicited later in the relative refractory period. Recovery of full excitability is much slower than recovery of the fast response. Impulses that arrive early in the relative refractory period are conducted much more slowly than those that arrive late in that period. The long refractory periods also lead to conduction blocks. Even when slow responses recur at low frequency, the fiber may be able to conduct only a fraction of these impulses; for example, in certain conditions only alternate impulses may be propagated (see later).
|
| page 301 | | | page 302 |
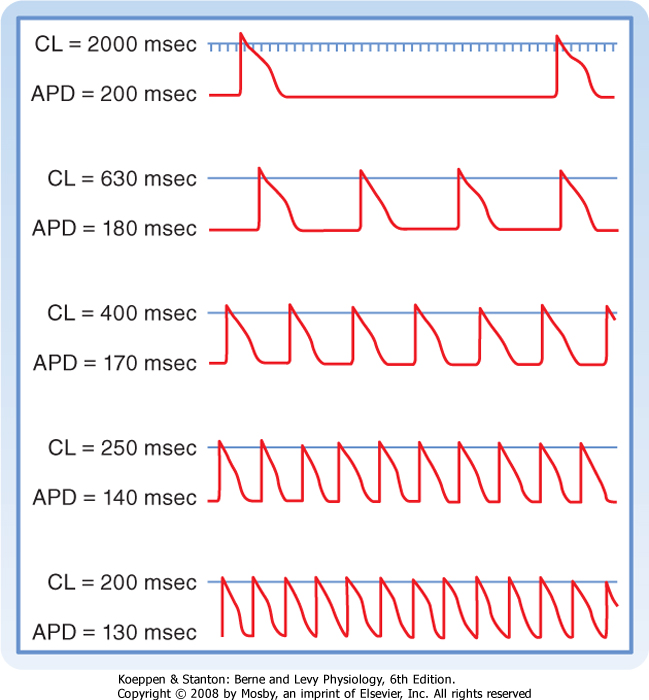
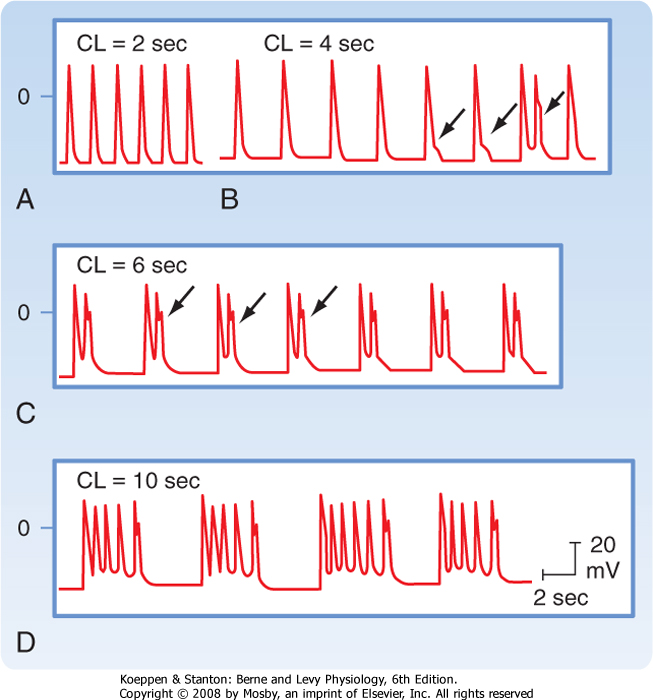
| Figure 16-16 Effect of changes in cycle length (CL) on the action potential duration (APD) of Purkinje fibers. (Modified from Singer D, Ten Eick RE: Am J Cardiol 28:381, 1971.) |
| Cycle length refers to the time between successive action potentials. Changes in cycle length alter the duration of the action potential in cardiac cells
(Fig. 16-16; also see Fig. 16-5) and thus change their refractory periods. Consequently, changes in cycle length are often important factors in the initiation or termination of certain arrhythmias (irregular heart rhythms).
|
| The changes in action potential duration produced by stepwise reductions in cycle length from 2000 to 200 msec in a Purkinje fiber are shown in Figure 16-16. Note that as cycle length diminishes, the duration of the action potential decreases. This direct correlation between action potential duration and cycle length is mediated by changes in gK that involve at least two types of K+ channels, namely, those that conduct the delayed rectifier K+ currents iKr and iKs and those that conduct the transient outward K+ current ito.
|
| The iK current is activated at values of Vm near zero, but the current activates slowly, remains activated for hundreds of milliseconds, and also inactivates very slowly. Consequently, as the basic cycle length diminishes, each action potential tends to occur earlier in the inactivation period of the iK current initiated by the preceding action potential. Therefore, the shorter the basic cycle length, the greater the outward K+ current during phase 2 and hence the shorter the action potential duration.
|
| The ito current also influences the relationship between cycle length and action potential duration. The ito current is also activated at near zero potential, and its magnitude varies inversely with cardiac cycle length. Therefore, as cycle length decreases, the consequent increase in the outward K+ current shortens the plateau.
|
| Figure 16-17 The cardiac conduction system. |
| NATURAL EXCITATION OF THE HEART AND THE ELECTROCARDIOGRAM
|
| Excitation of the heart normally occurs in an ordered fashion, which allows effective pumping of blood. This ordered excitation occurs via the heart's conduction system (Fig. 16-17). The SA node is the pacemaker of the heart and initiates the spread of action potentials throughout the atria. This spread of excitation reaches the AV node, where conduction is slowed such that atrial contraction can occur and the ventricles can be adequately filled. Excitation then spreads rapidly throughout the ventricles via the Purkinje fibers so that the ventricular myocytes contract in a coordinated manner. In the following, the properties of each component of the heart's conduction system are described.
|
| The autonomic nervous system controls various aspects of cardiac function, such as the heart rate and contraction strength. However, cardiac function does not require intact innervation. Indeed, a cardiac transplant patient, whose heart is completely denervated, may still adapt well to stressful situations. The ability of a denervated, transplanted heart to adapt to changing conditions lies in certain intrinsic properties of cardiac tissue, especially its automaticity.
|
| The properties of automaticity (the ability to initiate its own beat) and rhythmicity (the regularity of pacemaking activity) allow a perfused heart to beat even when it is completely removed from the body. The vertebrate heartbeat is myogenic in origin. If the coronary vasculature of an excised heart is artificially perfused with blood or an oxygenated electrolyte solution, rhythmic cardiac contractions may persist for many hours. At least some cells in the atria and ventricles can initiate beats; such cells reside mainly in nodal tissues or specialized conducting fibers of the heart.
|
| page 302 | | | page 303 |
| As noted, the region of the mammalian heart that ordinarily generates impulses at the greatest frequency is the SA node; it is the main cardiac pacemaker. Detailed mapping of the electrical potentials on the surface of the right atrium reveals that two or three sites of automaticity, located 1 or 2 cm from the SA node itself, serve along with the SA node as an atrial pacemaker complex. At times, all these loci initiate impulses simultaneously. At other times, the site of earliest excitation shifts from locus to locus, depending on certain conditions, such as the level of autonomic neural activity.
|
| In humans, the SA node is about 8 mm long and 2 mm thick, and it lies posteriorly in the groove at the junction between the superior vena cava and the right atrium. The sinus node artery runs lengthwise through the center of the node. The SA node contains two principal cell types: (1) small, round cells that have few organelles and myofibrils and (2) slender, elongated cells that are intermediate in appearance between the round and "ordinary" atrial myocardial cells. The round cells are probably the pacemaker cells; the slender, elongated cells probably conduct the impulses within the node and to the nodal margins.
|
| A typical transmembrane action potential recorded from an SA node cell is depicted in Figure 16-10, B. When compared with the transmembrane potential recorded from a ventricular myocardial cell (Fig. 16-10, A), the resting potential of the SA node cell is usually less negative, the upstroke of the action potential (phase 0) is less steep, the plateau is not sustained, and repolarization (phase 3) is more gradual. These are characteristic attributes of the slow response. As in cells that exhibit the slow response, tetrodotoxin (which blocks the fast Na+ current) has no influence on the SA nodal action potential because the action potential upstroke is not produced by an inward Na+ current through fast channels.
|
| The transmembrane potential during phase 4 is much less negative in SA (and AV) nodal automatic cells than in atrial or ventricular myocytes because nodal cells lack the iK1 (inward rectifying) type of K+ channel. Thus, the ratio of gK to gNa during phase 4 is much less in nodal cells than in myocytes. Hence, during phase 4, Vm deviates much more from the K+ equilibrium potential (EK) in nodal cells than it does in myocytes.
|
| The principal feature of a pacemaker cell that distinguishes it from the other cells that we have discussed resides in phase 4. In nonautomatic cells, the potential remains constant during this phase, whereas a pacemaker fiber is characterized by slow diastolic depolarization throughout phase 4. Depolarization proceeds at a steady rate until a threshold is attained, and an action potential is then triggered.
|
| Figure 16-18 Mechanisms involved in the changes in frequency of pacemaker firing. In A, a reduction in the slope (from a to b) of slow diastolic depolarization diminishes the firing frequency. In B, an increase in the threshold potential (from TP-1 to TP-2) or an increase in the magnitude of the maximum diastolic potential (from a to d) also diminishes the firing frequency. (From Hoffman BF, Cranefield PF: Electrophysiology of the Heart. New York, McGraw-Hill, 1960.) |
| Ordinarily, the frequency of pacemaker firing is controlled by the activity of both divisions of the autonomic nervous system. Increased sympathetic nervous activity, through the release of norepinephrine, raises the heart rate principally by increasing the slope of the slow diastolic depolarization. This mechanism of increasing heart rate occurs during physical exertion, anxiety, or certain illnesses such as febrile infectious diseases. |
| Increased vagal activity, through the release of acetylcholine, diminishes the heart rate by hyperpolarizing the pacemaker cell membrane and reducing the slope of the slow diastolic depolarization. These mechanisms of decreasing the heart rate occur when vagal activity is predominant over sympathetic activity. An extreme example is vasovagal syncope, a brief period of lightheadedness or loss of consciousness caused by an intense burst of vagal activity. This type of syncope is a reflex response to pain or to certain psychological stimuli. |
| Changes in autonomic neural activity do not usually change the heart rate by altering the threshold level of Vm in the nodal pacemaker cells. However, certain antiarrhythmic drugs, such as quinidine and procainamide, do raise the threshold potential of the automatic cells to less negative values. |
| page 303 | | | page 304 |
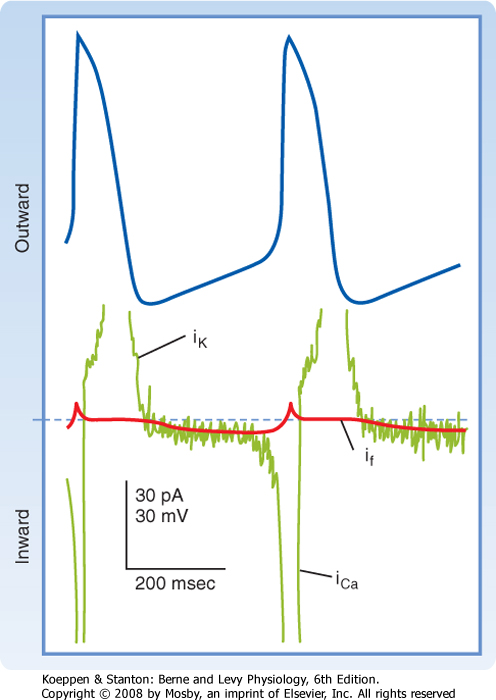
| Figure 16-19 The transmembrane potential changes (top half) that occur in SA node cells are produced by three principal currents (bottom half): (1) the current iCa; (2) a hyperpolarization-induced inward current, if; and (3) an outward K+ current, iK. The thin noisy green trace shows net membrane current and the approximate time course of (1) the repolarizing outward K+ current iK, (2) the hyperpolarization-induced inward current if, and (3) the L-type Ca++ current iCa. The thick bold red line in the current trace indicates the magnitude and direction of estimated If. (Redrawn from van Ginneken ACG, Giles W: J Physiol 434:57, 1991.) |
| Pacemaker cell frequency may be varied by a change in (1) the rate of depolarization during phase 4, (2) the maximal negativity during phase 4, or (3) the threshold potential (Fig. 16-18). When the rate of slow diastolic depolarization is increased, the threshold
potential is attained earlier, and the heart rate increases. A rise in the threshold potential delays the onset of phase 0, and the heart rate is reduced. Similarly, when the maximal negative potential is increased, more time is required to reach the threshold potential, when the slope of phase 4 remains unchanged, and the heart rate therefore diminishes.
|
| Ionic Basis of Automaticity
|
| Several ionic currents contribute to the slow diastolic depolarization that characteristically occurs in the automatic cells in the heart. In the pacemaker cells of the SA node, at least three ionic currents mediate the slow diastolic depolarization: (1) an outward K+ current, iK; (2) an inward current, if, induced by hyperpolarization; and (3) an inward Ca++ current, ICa (Fig. 16-19).
|
| The "f"-current (If) in cardiac SA node cells is activated by hyperpolarization and gated by cyclic nucleotides and is designated HCN. There are four members of the HCN gene family, and such channels are found in central nervous system neurons that generate action potentials repetitively. Transmembrane segment 4 (S4) has many positively charged amino acids that act as voltage sensors, as also found in voltage-gated Na+, K+, and Ca++ channels. The dominant channel expressed in heart is derived from the HCN4 gene. Mutations in amino acids in S4 and in the S4-to-S5 linker cause marked changes in the voltage dependence of activation such that greater hyperpolarization is needed to open the channel. This effect is like that of acetylcholine, and it has been predicted that the occurrence of such mutations in the human heart could underlie sinus bradycardia and sick sinus syndrome. |
|
| The repetitive firing of the pacemaker cell begins with the delayed rectifier K+ current iK. Efflux of K+ tends to repolarize the cell after the upstroke of the action potential. K+ continues to move out well beyond the time of maximal repolarization, but its efflux diminishes throughout phase 4 (Fig. 16-19). As the current
diminishes, its opposition to the depolarizing effects of the two inward currents (if and iCa) also gradually decreases. The progressive diastolic depolarization is mediated by the two inward currents if and iCa, which oppose the repolarizing effect of the outward current iK.
|
| The inward current if is activated near the end of repolarization and is carried mainly by Na+ through specific channels that differ from the fast Na+ channels. The current was dubbed "funny" because its discoverers had not expected to detect an inward Na+ current in pacemaker cells at the end of repolarization. This current is activated as the membrane potential becomes hyperpolarized beyond -50 mV. The more negative the membrane potential at this time, the greater the activation of if.
|
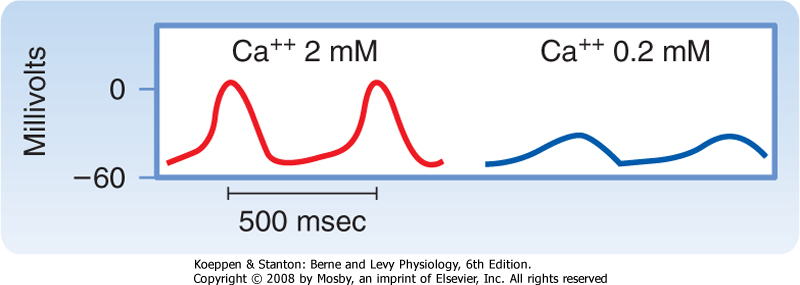
| The second current responsible for diastolic depolarization is the Ca++ current iCa. This current is activated toward the end of phase 4 as the transmembrane potential reaches a value of about -55 mV (Fig. 16-19). Once the Ca++ channels are activated, influx of Ca++ into the cell increases. This influx accelerates the rate of diastolic depolarization, which then leads to the action potential upstroke. A decrease in [Ca++]o (Fig. 16-20) or the addition of Ca++ channel antagonists diminishes the amplitude of the action potential and the slope of the slow diastolic depolarization in SA node cells. Recent evidence indicates that additional ion currents, including a sustained (background) inward Na+ current (iNa), the T-type Ca++ current, and the Na/Ca exchange current triggered by spontaneous release of Ca++ from the sarcoplasmic reticulum (SR), may also be involved in pacemaking. These observations illustrate the manifold ways to sustain this vital function.*
|
| page 304 | | | page 305 |
| Figure 16-20 Transmembrane action potentials recorded from an SA node pacemaker cell. The concentration of Ca++ in the bath was reduced from 2 to 0.2 mM. (Modified from Kohlhardt M et al: Basic Res Cardiol 71:17, 1976.) |
| Regions of the heart other than the SA node may initiate beats in special circumstances. Such sites are called ectopic foci or ectopic pacemakers. Ectopic foci may become pacemakers when (1) their own rhythmicity becomes enhanced, (2) the rhythmicity of the higher-order pacemakers becomes depressed, or (3) all conduction pathways between the ectopic focus and regions with greater rhythmicity become blocked. Ectopic pacemakers may act as a safety mechanism when normal pacemaking centers fail. However, if an ectopic center fires while the normal pacemaking center still functions, the ectopic activity may induce either sporadic rhythm disturbances, such as premature depolarizations, or continuous rhythm disturbances, such as paroxysmal tachycardias (see later section). |
|
| The autonomic neurotransmitters affect automaticity by altering membrane ionic currents. The adrenergic transmitters increase all three currents involved in SA nodal automaticity. To increase the slope of diastolic depolarization, the augmentation of if and iCa by adrenergic transmitters must exceed the enhancement of iK by these same transmitters.
|
| The hyperpolarization induced by acetylcholine released from vagus nerve endings in the heart is achieved by the activation of specific K+ channels, the acetylcholine-regulated K+ channels (KACh). Acetylcholine also depresses the if and iCa currents. The autonomic neural effects on cardiac cells are described in greater detail in Chapter 18.
|
| When the SA node or other components of the atrial pacemaker complex are excised or destroyed, pacemaker cells in the AV junction generally take over the pacemaker function for the entire heart. After some time, which may vary from minutes to days, automatic cells in the atria usually become dominant again and resume their pacemaker function. Purkinje fibers in the specialized conduction system of the ventricles also display automaticity. Characteristically, these fibers fire at a very slow rate. When the AV junction cannot conduct cardiac impulses from the atria to the ventricles, these idioventricular pacemakers in the Purkinje fiber network initiate the ventricular contractions, but at a frequency of only 30 to 40 beats/min.
|
| If an ectopic focus in one of the atria suddenly began to fire at a high rate (e.g., 150 impulses/min) in an individual with a normal heart rate of 70 beats/min, the ectopic site would become the pacemaker for the entire heart. If that rapid ectopic focus suddenly stopped firing, the SA node will remain briefly quiescent because of overdrive suppression. The interval from the end of the period of overdrive until the SA node resumes firing is called the sinus node recovery time. In patients with sick sinus syndrome, the sinus node recovery time is prolonged. The consequent period of asystole (absence of a heartbeat) may cause loss of consciousness. |
|
| The automaticity of pacemaker cells diminishes after these cells have been excited at a high frequency. This phenomenon is known as overdrive suppression. Because the intrinsic rhythmicity of the SA node is greater than that of the other latent pacemaking sites in the heart, firing of the SA node tends to suppress the automaticity in other loci.
|
| Overdrive suppression results from the activity of membrane Na+,K+-ATPase. A certain amount of Na+ enters the cardiac cell during each depolarization. The more frequently the cell is depolarized, the more Na+ enters the cell per minute. At high excitation frequencies, the activity of Na+,K+-ATPase increases to extrude this larger amount of Na+ from the cell. The activity of Na+,K+-ATPase hyperpolarizes the cell because 3 Na+ ions are extruded by the pump in exchange for 2 K+ ions that enter the cell (see Chapter 1). Therefore, slow diastolic depolarization requires more time to reach the firing threshold. In addition, when the overdrive suddenly ceases, the activity of Na+,K+-ATPase does not slow instantaneously but temporarily remains overactive. This continued extrusion of Na+ opposes the gradual depolarization of the pacemaker cell during phase 4, and it temporarily suppresses the cell's intrinsic automaticity.
|
| From the SA node, the cardiac impulse spreads radially throughout the right atrium (Fig. 16-17) along ordinary atrial myocardial fibers at a conduction velocity of about 1 m/sec. A special pathway, the anterior interatrial myocardial band (or Bachmann's bundle), conducts the SA node impulse directly to the left atrium. The wave of excitation proceeds inferiorly through the right atrium and ultimately reaches the AV node (Fig. 16-17), which is normally the sole entry route of the cardiac impulse to the ventricles.
|
| page 305 | | | page 306 |
| Some people have accessory AV pathways. Because these pathways often serve as a part of a reentry loop (see later), they can be associated with serious cardiac rhythm disturbances. Wolff-Parkinson-White syndrome, a congenital disturbance, is the most common clinical disorder in which a bypass tract of myocardial fibers becomes an accessory pathway between the atria and ventricles. Ordinarily, the syndrome causes no functional abnormality. The disturbance is easily detected on an ECG because a portion of the ventricle is excited via the bypass tract before the remainder of the ventricle is excited via the AV node and His-Purkinje system. This preexcitation can be seen as a bizarre configuration in the ventricular (QRS) complex of the ECG. Occasionally, however, a reentry loop develops in which the atrial impulse travels to the ventricles via one of the two AV pathways (AV node or bypass tract) and then back to the atria through the other of these two pathways. Continuous circling around the loop leads to a very rapid rhythm (supraventricular tachycardia). This rapid rhythm may be incapacitating because it might not allow sufficient time for ventricular filling. Transient block of the AV node by injecting adenosine intravenously or by increasing vagal activity reflexively (by pressing on the neck over the carotid sinus region) usually abolishes the tachycardia and restores a normal sinus rhythm. |
|
| When compared with the potential recorded from a typical ventricular fiber, the atrial plateau (phase 2) is briefer and less developed, and repolarization (phase 3) is slower (Fig. 16-10). The action potential duration in atrial myocytes is briefer than that in ventricular myocytes because efflux of K+ is greater during
the plateau in atrial myocytes than in ventricular myocytes.
|
| Atrioventricular Conduction
|
| The atrial excitation wave reaches the ventricles via the AV node. In adult humans, this node is approximately 15 mm long, 10 mm wide, and 3 mm thick. The node is situated posteriorly on the right side of the interatrial septum near the ostium of the coronary sinus. The AV node contains the same two cell types as the SA node, but the round cells in the AV node are less abundant and the elongated cells predominate.
|
| The AV node is made up of three functional regions: (1) the AN region, or the transitional zone between the atrium and the remainder of the node; (2) the N region, or the midportion of the AV node; and (3) the NH region, or the zone in which nodal fibers gradually merge with the bundle of His, which is the upper portion of the specialized conducting system for the ventricles (Fig. 16-17). Normally, the AV node and the bundle of His are the only pathways along which the cardiac impulse travels from atria to ventricles.
|
| Figure 16-21 Transmembrane potentials recorded from an atrioventricular (AV) node cell under control conditions (C) and in the presence of the Ca++ channel antagonist diltiazem at concentrations of 0.1, 0.3, and 1 mmol/L. (Redrawn from Hirth C et al: J Mol Cell Cardiol 15:799, 1983.) |
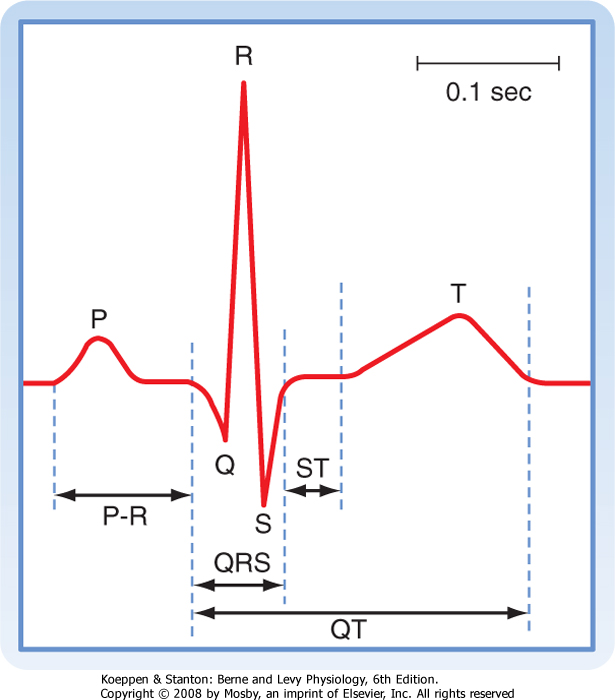
| Several features of AV conduction are of physiological and clinical significance. The principal delay in conduction of impulses from the atria to the ventricles occurs in the AN and N regions of the AV node. Conduction velocity is actually less in the N region than in the AN region. However, the path length is substantially greater in the AN than the N region. Conduction
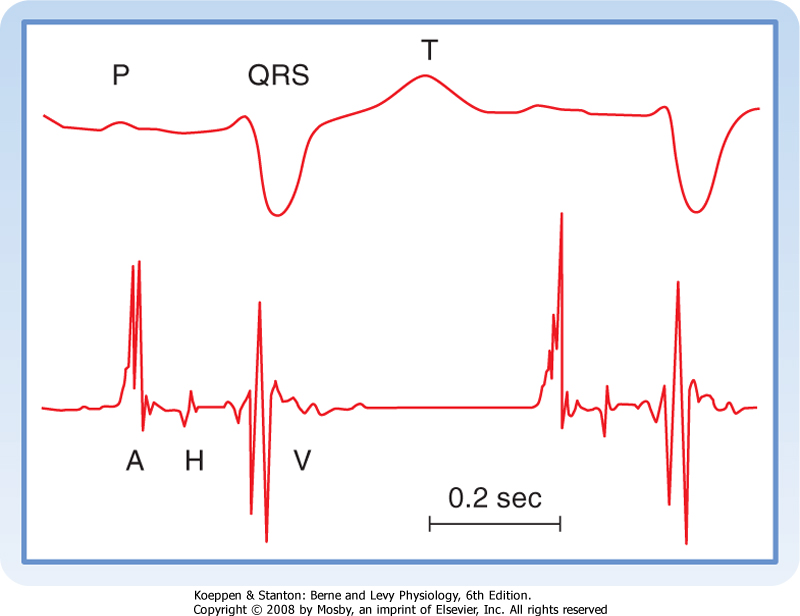
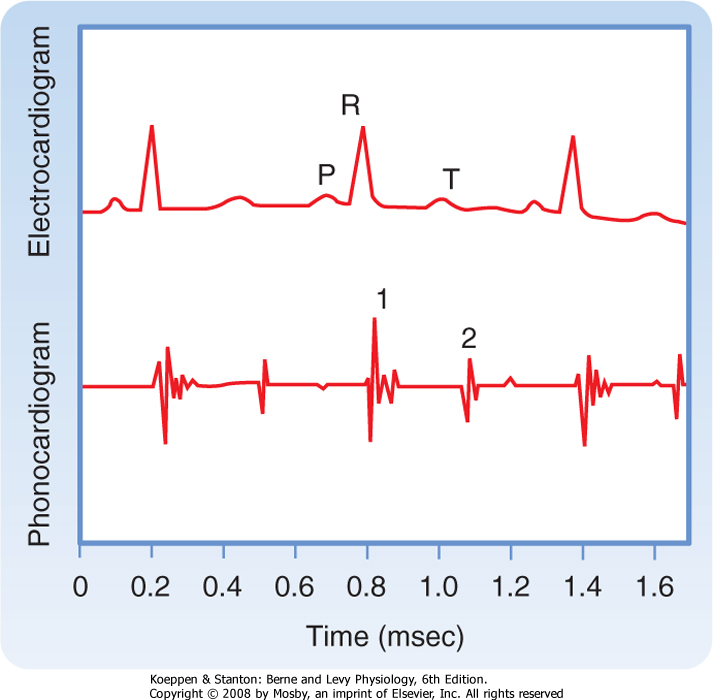
times through the AN and N zones account for the delay between the start of the P wave (the electrical manifestation of atrial excitation) and the QRS complex (the electrical manifestation of ventricular excitation) on an ECG (see later). Functionally, the delay between atrial and ventricular excitation permits optimal ventricular filling during atrial contraction.
|
| In the N region, slow-response action potentials prevail. The resting potential is about -60 mV, the upstroke velocity is low (about 5 V/sec), and the conduction velocity is about 0.05 m/sec.* Tetrodotoxin, which blocks the fast Na+ channels, has virtually no effect on action potentials in this region (or on any other slow-response fibers). Conversely, Ca++ channel antagonists decrease the amplitude and duration of the action potentials (Fig. 16-21) and depress AV conduction.
|
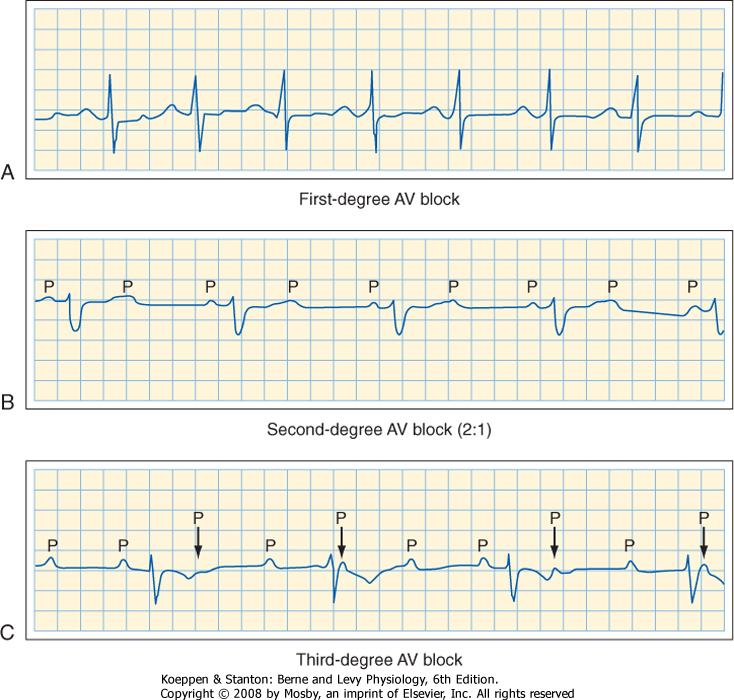
| Like other slow-response action potentials, the relative refractory period of cells in the N region extends well beyond the period of complete repolarization; that is, these cells display postrepolarization refractoriness (Fig. 16-15). As the heart rate increases, the time between successive atrial depolarizations is decreased, and conduction through the AV junction slows. Abnormal prolongation of the AV conduction time is called a first-degree AV block (see later). Most of the prolongation of AV conduction induced by a decrease in atrial cycle length takes place in the N region of the AV node.
|
| page 306 | | | page 307 |
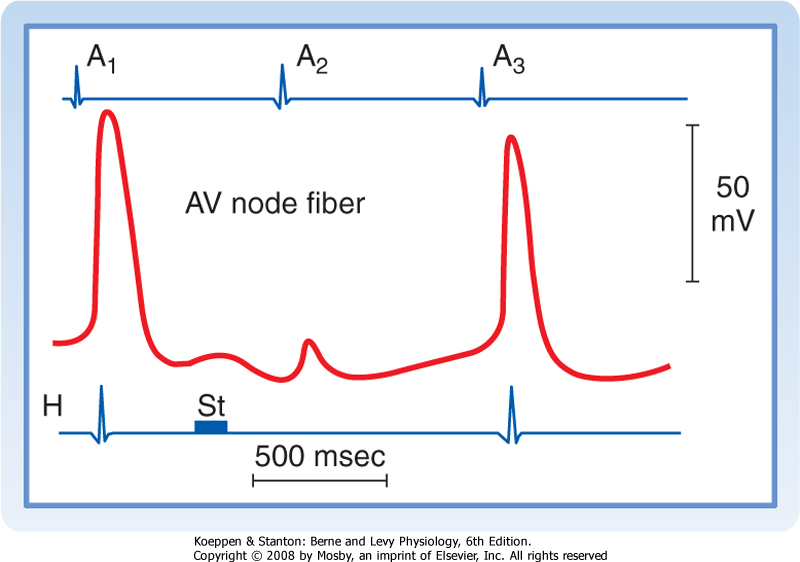
| Figure 16-22 Effects of a brief vagal stimulus (St) on the transmembrane potential recorded from an AV nodal fiber. Note that shortly after vagal stimulation, the membrane of the fiber was hyperpolarized. The atrial excitation (A2) that arrived at the AV node when the cell was hyperpolarized failed to be conducted, as denoted by the absence of a depolarization in the His electrogram (H). The atrial excitations that preceded (A1) and followed (A3) excitation A2 were conducted to the His bundle region. (Redrawn from Mazgalev T et al: Am J Physiol 251:H631, 1986.) |
| Impulses tend to be blocked in the AV node at stimulation frequencies that are easily conducted in other regions of the heart. If the atria are depolarized at a high repetition rate, only a fraction (e.g., half) of the atrial impulses might be conducted through the AV junction to the ventricles. The conduction pattern in which only a fraction of the atrial impulses are conducted to the ventricles is called a second-degree AV block (see later). This type of block may protect the ventricles from excessive contraction frequencies,
wherein the filling time between contractions might be inadequate.
|
| Retrograde conduction can occur through the AV node. However, the conduction time is significantly longer and the impulse is blocked at lower repetition rates when the impulse is conducted in the retrograde instead of the antegrade direction. Finally the AV node is a common site for reentry (see later).
|
| As in the SA node, the autonomic nervous system regulates AV conduction. Weak vagal activity may simply prolong the AV conduction time. Thus, for any given atrial cycle length, the atrium-to-His (A-H) or atrium-to-ventricle (A-V) conduction time will be prolonged by vagal stimulation. Stronger vagal activity may cause some or all of the impulses arriving from the atria to be blocked in the node. The conduction pattern in which none of the atrial impulses reaches the ventricles is called a third-degree, or complete, AV block (see later). The vagally induced delay or absence of conduction through the AV junction occurs mainly in the N region of the node. This effect of vagal stimulation reflects the action of acetylcholine to hyperpolarize the membrane potential of the conducting fibers in the N region (Fig. 16-22). The greater the hyperpolarization at the time of arrival of the atrial impulse, the more impaired the AV conduction.
|
| Cardiac sympathetic nerves, in contrast, facilitate AV conduction. They decrease the AV conduction time and enhance the rhythmicity of latent pacemakers in the AV junction. The norepinephrine released at the postganglionic sympathetic nerve terminals increases the amplitude and slope of the upstroke of the AV nodal action potentials, principally in the AN and N regions of the node.
|
| Conduction of impulses in the right or left bundle branch or in either division of the left bundle branch may be impaired. Conduction blocks may develop in one or more of these conduction pathways as a consequence of coronary artery disease or degenerative processes associated with aging, and they give rise to characteristic ECG patterns. Block of either of the main bundle branches is known as right or left bundle branch block. Block of either division of the left bundle branch is called left anterior or left posterior hemiblock. |
|
| The bundle of His passes subendocardially down the right side of the interventricular septum for about
1 cm and then divides into the right and left bundle branches (Fig. 16-17). The right bundle branch, a direct continuation of the bundle of His, proceeds down the right side of the interventricular septum. The left bundle branch, which is considerably thicker than the right, arises almost perpendicular from the bundle of His and perforates the interventricular septum. On the subendocardial surface of the left side of the interventricular septum, the left bundle branch splits into a thin anterior division and a thick posterior division.
|
| The right bundle branch and the two divisions of the left bundle branch ultimately subdivide into a complex network of conducting fibers, called Purkinje fibers, that spread out over the subendocardial surfaces of both ventricles.
|
| Purkinje fibers have abundant, linearly arranged sarcomeres, as do myocytes. However, the T tubular system, which is well developed in myocytes, is absent in the Purkinje fibers of many species. Purkinje fibers are the broadest cells in the heart: 70 to 80 μm in diameter, as compared with diameters of 10 to 15 μm for ventricular myocytes. Partly because of the large diameter of the Purkinje fibers, conduction velocity (1 to 4 m/sec) in these fibers exceeds that in any other fiber type within the heart. The increased conduction velocity permits rapid activation of the entire endocardial surface of the ventricles.
|
| page 307 | | | page 308 |
| The action potentials recorded from Purkinje fibers resemble those of ordinary ventricular myocardial fibers. However, because of the long refractory period of Purkinje fiber action potentials, many premature excitations of the atria are conducted through the AV junction but are then blocked by the Purkinje fibers. Blockade of these atrial excitations prevents premature contraction of the ventricles. This function of protecting the ventricles against the effects of premature atrial depolarization is especially pronounced at slow heart rates because the action potential duration and hence the effective refractory period of the Purkinje fibers vary inversely with the heart rate (Fig. 16-16). At slow heart rates, the effective refractory period of the Purkinje fibers is especially prolonged.* In contrast to Purkinje fibers, the effective refractory period of AV node cells does not change appreciably over the
normal range of heart rates and actually increases at very rapid heart rates. Therefore, when the atrium is excited at high repetition rates, it is the AV node that normally protects the ventricles from these excessively high frequencies.
|
| The first portions of the ventricles to be excited by impulses arriving from the AV node are the interventricular septum (except the basal portion) and the papillary muscles. The activation wave spreads into the substance of the septum from both its left and right endocardial surfaces. Early contraction of the septum makes it more rigid and allows it to serve as an anchor point for contraction of the remaining ventricular myocardium. Furthermore, early contraction of the papillary muscles prevents eversion of the AV valves into the atria during ventricular systole.
|
| The endocardial surfaces of both ventricles are activated rapidly, but the wave of excitation spreads from endocardium to epicardium at a slower velocity (about 0.3 to 0.4 m/sec). The epicardial surface of the right ventricle is activated earlier than that of the left ventricle because the right ventricular wall is appreciably thinner than the left. In addition, the apical and central epicardial regions of both ventricles are activated somewhat earlier than their respective basal regions. The last portions of the ventricles to be excited are the posterior basal epicardial regions and a small zone in the basal portion of the interventricular septum.
|
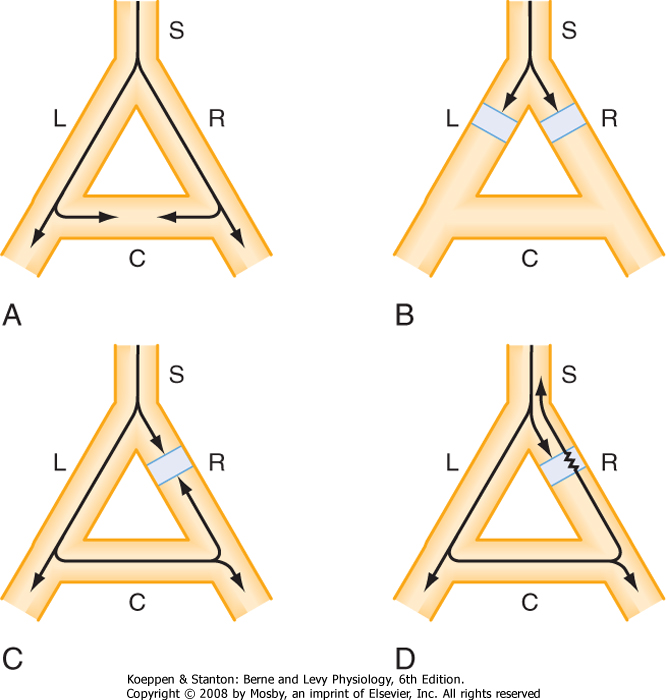
| The conditions necessary for reentry are illustrated in Figure 16-23. In each of the four panels a single bundle (S) of cardiac fibers splits into a left (L) and a right (R) branch. A connecting bundle (C) runs between the two branches. Normally the impulse moving down bundle S is conducted along the L and R branches (Fig. 16-23, A). As the impulse reaches connecting link C, it enters from both sides and becomes extinguished at the point of collision. The impulse from the left side cannot proceed because the tissue beyond is absolutely refractory; it has just been depolarized from the other direction. The impulse also cannot pass through bundle C from the right for the same reason.
|
| Figure 16-23, B, shows that the impulse cannot complete the circuit if an antegrade block exists in the L and R branches of the fiber bundle. Furthermore, if a bidirectional block exists at any point in the loop (e.g., branch R in Fig. 16-23, C), the impulse also cannot reenter.
|
| Under certain conditions, a cardiac impulse may re-excite some myocardial region through which it had passed previously. This phenomenon, known as reentry, is responsible for many clinical arrhythmias (disturbances in cardiac rhythm). The reentry may be ordered or random. In the ordered variety the impulse traverses a fixed anatomic path, whereas in the random type the path continues to change. |
|
| A necessary condition for reentry is that at some point in the loop the impulse can pass in one direction but not in the other. This phenomenon is called unidirectional block. As shown in Figure 16-23, D, the impulse may travel down branch L normally but become blocked in the antegrade direction in branch R because of some pathological change in the myocardial cells in that branch. The impulse that was conducted down branch L and through the connecting branch C may then be able to penetrate the depressed region in branch R from the retrograde direction, even though the antegrade impulse had been blocked previously at this same site. Why is the antegrade impulse blocked but not the retrograde impulse? The reason is that the antegrade impulse arrives at the depressed region in branch R earlier than the retrograde impulse does because the path length of the antegrade impulse is very short whereas the retrograde impulse traverses a much longer path. Therefore, the antegrade impulse may be blocked simply because it arrives at the depressed region during its effective refractory period. If the retrograde impulse is delayed sufficiently, the refractory period may have ended in the affected region, and the impulse can then be conducted back through this region and return to bundle S.
|
|
| Figure 16-23 The role of unidirectional block in reentry. In A, an excitation wave traveling down a single bundle (S) of fibers continues down the left (L) and right (R) branches. The depolarization wave enters the connecting branch (C) from both ends and is extinguished at the zone of collision. In B, the wave is blocked in the L and R branches. In C, a bidirectional block exists in branch R. In D, a unidirectional block exists in branch R. The antegrade impulse is blocked, but the retrograde impulse is conducted through and reenters bundle S. |
| page 308 | | | page 309 |
| Although unidirectional block is a necessary condition for reentry, it alone cannot cause reentry. For reentry to occur, the effective refractory period of the reentered region must be shorter than the conduction time around the loop. In Figure 16-23, D, if the tissue
just beyond the depressed zone in branch R is still refractory from the antegrade depolarization, the retrograde impulse will not be conducted into branch S. Therefore, the conditions that promote reentry are those that prolong the conduction time or shorten the effective refractory period.
|
| The functional characteristics of the various components of the reentry loops responsible for specific cardiac arrhythmias are diverse. Some loops are large and involve entire specialized conduction bundles, whereas others are microscopic. The loop may include myocardial fibers, specialized conducting fibers, nodal cells, and junctional tissues in almost any conceivable arrangement. In addition, the various cardiac cells in the loop may be normal or abnormal.
|
| The propagation velocity along a multicellular cardiac conduction fiber is normally facilitated by the gap junctions that lie between consecutive conducting fibers. Variations in the protein structure of the connexins in the gap junctions can affect the propagation velocity along these fibers. The chemical structure of the specific connexins can vary locally in cardiac tissues and, as a result, can establish local variations in propagation velocity. Such topical variations in velocity might include regions of unidirectional block that induce reentrant rhythm disturbances.
|
| Triggered activity is so named because it is always coupled to a preceding action potential. Because reentrant activity is also coupled to a preceding action potential, the arrhythmias induced by triggered activity are usually difficult to distinguish from those induced by reentry. Triggered activity is caused by afterdepolarizations. Two types of afterdepolarizations are recognized: early (EAD) and delayed (DAD). EADs may appear either at the end of the action potential plateau (phase 2) or about midway through repolarization (phase 3), whereas DADs occur near the very end of repolarization or just after full repolarization (phase 4).
|
| Early Afterdepolarizations
|
| Recently, mutations in the connexin 40 gene (GJA5) have been found to underlie the development of atrial fibrillation in some patients with this rhythm disorder. This mutation appears to impair the assembly of gap junctions in myocytes and therefore reduces electrical coupling of the cells (see Gollob MH et al: N Engl J Med 354:2677, 2006). |
|
| EADs are more likely to occur when the prevailing heart rate is slow; a rapid heart rate suppresses EADs (Fig. 16-24). EADs are also more likely to occur in cardiac cells with prolonged action potentials than in cells with shorter action potentials. For example, EADs can be induced more readily in myocytes from the midmyocardial region of the ventricular walls than in
myocytes from the endocardial or epicardial regions because of the longer action potential of midmyocardial myocytes (Fig. 16-5). Certain antiarrhythmic drugs, such as quinidine, prolong the action potential. Consequently, such drugs increase the likelihood that EADs may occur. Hence, antiarrhythmic drugs are also sometimes proarrhythmic.
|
| The direct correlation between a cell's action potential duration and its susceptibility to EADs is probably related to the time required for Ca++ channels in the cell membranes to recover from inactivation. When action potentials are sufficiently prolonged, the Ca++ channels that were activated at the beginning of the plateau have sufficient time to recover from inactivation and thus may be reactivated before the cell fully repolarizes. This secondary activation could then trigger an EAD.
|
| Delayed Afterdepolarizations
|
| Figure 16-24 Effect of pacing at different cycle lengths (CL) on cesium-induced early afterdepolarizations (EADs) in a Purkinje fiber. A, EADs not evident. B, EADs first appear (arrows). The third EAD reaches threshold and triggers an action potential (third arrow). C, EADs that appear after each driven depolarization trigger an action potential. D, Triggered action potentials occur in salvos. (Modified from Damiano BP, Rosen M: Circulation 69:1013, 1984.) |
| page 309 | | | page 310 |
| Figure 16-25 Transmembrane action potentials recorded from Purkinje fibers. Acetylstrophanthidin, a cardiac glycoside, was added to the bath, and sequences of six driven beats (denoted by the dots) were produced at a basic cycle length (BCL) of 800 (A), 700 (B), 600 (C), and 500 (D) msec. Note that delayed afterpotentials occurred after the driven beats and that these afterpotentials reached threshold after the last driven beat in B to D. (From Ferrier GR et al: Circ Res 32:600, 1973.) |
| In contrast to EADs, DADs are more likely to occur when the heart rate is high (Fig. 16-25). DADs are associated with elevated [Ca++]i. The amplitudes of DADs are increased by interventions that raise [Ca++]i, such as increasing [Ca++]o and administering toxic amounts of digitalis glycosides. The elevated levels of intracellular Ca++ provoke the oscillatory release of Ca++ from the SR. Hence, in myocardial cells, DADs are accompanied by small rhythmic changes in the force developed. The high [Ca++]i also activates certain membrane channels that permit the passage of Na+ and K+. The net flux of these cations constitutes a transient inward
current, iti, that contributes to the appearance of DADs. The elevated [Ca++]i may also activate the 3Na+-1Ca++ antiporter. This electrogenic antiporter, which moves 3 Na+ ions into the cell for each Ca++ ion that it ejects, also creates a net inward cation current that contributes to the appearance of DADs.
|
| The ECG enables physicians to infer the course of the cardiac impulse by recording the variations in electrical potential at various loci on the surface of the body. By analyzing the details of these fluctuations in electrical potential, the physician gains valuable insight into (1) the anatomical orientation of the heart; (2) the relative sizes of its chambers; (3) various disturbances in rhythm and conduction; (4) the extent, location, and progress of ischemic damage to the myocardium; (5) the effects of altered electrolyte concentrations; and (6) the influence of certain drugs (notably digitalis, antiarrhythmic agents, and Ca++ channel antagonists). Because electrocardiography is an extensive and complex discipline, only the elementary principles are considered in this section.
|
| Scalar Electrocardiography
|
| In electrocardiography, a lead is the electrical connection from the patient's skin to a recording device (electrocardiograph) that measures the electrical activity of the heart. The system of leads used to record routine ECGs is oriented in certain planes of the body. The diverse electrical events that exist in the heart at any moment can be represented by a three-dimensional vector (a quantity with magnitude and direction). A system of recording leads oriented in a given plane detects only the projection of the three-dimensional vector on that plane. The potential difference between two recording electrodes represents the projection of the vector on the line between the two leads. Components of vectors projected on such lines are not vectors but scalar quantities (having magnitude, but not direction). Hence, a recording of changes in the difference in potential between two points on the skin surface over time is called a scalar ECG.
|
| A scalar ECG detects temporal changes in the electrical potential between some point on the surface of the skin and an indifferent electrode or between pairs of points on the skin surface. The cardiac impulse progresses through the heart in a complex three-dimensional pattern. Hence, the precise configuration of the ECG varies from individual to individual, and in any given individual the pattern varies with the anatomic location of the leads. The graphic display of the electrical impulse recorded by an ECG is called a tracing.
|
| page 310 | | | page 311 |
| Figure 16-26 Important deflections and intervals of a typical scalar ECG. |
| In general, a tracing consists of P, QRS, and T waves (Fig. 16-26). The P wave reflects the spread of depolarization through the atria, the QRS wave (or complex) reflects depolarization of the ventricles, and the T wave represents repolarization of the ventricles (repolarization of the atria occurs and is therefore masked during ventricular depolarization). The PR interval (or more precisely, the PQ interval) is a measure of the time from the onset of atrial activation to the onset of ventricular activation; it normally ranges from 0.12 to 0.20 second. A large fraction of this time involves passage of the impulse through the AV conduction system. Pathological prolongations of the PR interval are associated with disturbances in AV conduction. Such disturbances may be produced by
inflammatory, circulatory, pharmacologic, or nervous mechanisms.
|
| The configuration and amplitude of the QRS complex vary considerably among individuals. The duration is usually between 0.06 and 0.10 second. An abnormally prolonged QRS complex may indicate a block in the normal conduction pathways through the ventricles (such as a block of the left or right bundle branch). During the ST interval, the entire ventricular myocardium is depolarized. Therefore, the ST segment normally lies on the isoelectric line. Any appreciable deviation of the ST segment from the isoelectric line may indicate ischemic damage to the myocardium. The QT interval, sometimes referred to as the period of "electrical systole" of the ventricles, is closely correlated with the mean action potential duration of the ventricular myocytes. The duration of the QT interval is about 0.4 second, but it varies inversely with the heart rate, mainly because the duration of the myocardial cell action potential varies inversely with the heart rate (Fig. 16-16).
|
| In most leads, the T wave is deflected in the same direction from the isoelectric line as the major component of the QRS complex, although biphasic (that is, oppositely directed) T waves are perfectly normal in certain leads. Deviation of the T wave and QRS complex in the same direction from the isoelectric line indicates that the repolarization process is proceeding in a direction counter to that of the depolarization process. T waves that are abnormal either in direction or in amplitude may indicate myocardial damage, electrolyte disturbances, or cardiac hypertrophy.
|
| Figure 16-27 Einthoven triangle illustrating the electrocardiographic connections for standard limb leads I, II, and III. |
| The original ECG lead system was devised by Einthoven about a century ago. In this system, the vector sum of all cardiac electrical activity at any moment is called the resultant cardiac vector. This directional electrical force is considered to lie in the center of an
equilateral triangle whose apices are located in the left and right shoulders and the pubic region (Fig. 16-27). This triangle, called Einthoven's triangle, is oriented in the frontal plane of the body. Hence, only the projection of the resultant cardiac vector on the frontal plane is detected by this system of leads. For convenience, the electrodes are connected to the right and left forearms rather than to the corresponding shoulders because the arms represent simple electrical extensions of leads from the shoulders. Similarly, the leg represents an extension of the lead system from the pubis, and thus the third electrode is generally connected to an ankle (usually the left one).
|
| page 311 | | | page 312 |
| Certain conventions dictate the manner in which these standard limb leads are connected to the electrocardiograph. Lead I records the potential difference between the left arm (LA) and the right arm (RA). The connections are such that when the potential at LA (VLA) exceeds the potential at RA (VRA), the tracing is deflected upward from the isoelectric line. In Figures 16-27 and 16-28, this arrangement of connections for lead I is designated by a (+) at LA and by a (-) at RA. Lead II records the potential difference between RA and LL (left leg), and the tracing is deflected upward
when VLL exceeds VRA. Finally, lead III registers the potential difference between LA and LL, and the tracing is deflected upward when VLL exceeds VLA. These connections were arbitrarily chosen so that the QRS complexes are upright in all three standard limb leads in most normal individuals.
|

|
| Figure 16-28 Magnitude and direction of the QRS complexes in limb leads I, II, and III when the mean electrical axis () is 60 degrees (A), 120 degrees (B), and 0 degrees (C). |
| If the frontal projection of a resultant cardiac vector at some moment is represented by an arrow (tail negative, head positive), as in Figure 16-27, the potential difference, VLA - VRA, recorded in lead I is represented by the component of the vector projected along the horizontal line between LA and RA, also shown in Figure 16-27. If the vector makes an angle () of 60 degrees with the horizontal line (as in Fig. 16-28, A), the deflection recorded in lead I is upward because the positive arrowhead lies closer to LA than to RA. The deflection in lead II is also upright because the arrowhead lies closer to LL than to RA. The magnitude of the lead II deflection is greater than that in lead I
because in this example the direction of the vector parallels that of lead II; therefore, the magnitude of the projection on lead II exceeds that on lead I. Similarly, in lead III, the deflection is upright and its magnitude equals that in lead I.
|
| If the vector in Figure 16-27, A, is the result of electrical events that occur during the peak of the QRS complex, the orientation of this vector is said to represent the mean electrical axis of the heart in the frontal plane. The positive rotatory direction of this axis is taken to be in the clockwise direction from the horizontal plane (contrary to the usual mathematical convention). In normal individuals, the average mean electrical axis is approximately +60 degrees (as in Fig. 16-28, A). Therefore, QRS complexes are usually upright in all three leads and largest in lead II.
|
| If the mean electrical axis shifts substantially to the right (as in Fig. 16-28, B, where = 120 degrees), projections of the QRS complexes on the standard leads change considerably. In this case, the largest upright deflection is in lead III, and the deflection in lead I is inverted because the arrowhead is closer to RA than to LA. Such a shift is termed right axis deviation and occurs with hypertrophy (i.e., increased thickness) of the right ventricle. When the axis shifts to the left, as occurs with hypertrophy of the left ventricle (Fig. 16-28, C, where = 0 degrees), the largest upright deflection is in lead I, and the QRS complex in lead III is inverted.
|
| Changes in the mean electrical axis may occur if the anatomic position of the heart is altered or if the relative mass of the right and left ventricles is abnormal, as it is in certain cardiovascular disturbances. For example, the axis tends to shift toward the left (more horizontal) in short, stocky individuals and toward the right (more vertical) in tall, thin persons. In addition, in left or right ventricular hypertrophy (increased myocardial mass of either ventricle), the axis shifts toward the hypertrophied side. |
| page 312 | | | page 313 |
| In addition to limb leads I, II, and III, other limb leads that are also oriented in the frontal plane are routinely recorded in patients. These leads are (1) aVR, where the right arm is defined as the positive lead and the middle of the heart is defined as the negative lead (i.e., the left arm and ankle leads are connected together); (2) aVL, where the left arm is the positive lead and the middle of the heart is defined as the negative lead (i.e., the right arm and ankle leads are connected together); and (3) aVF, where the ankle (foot) lead is defined as positive and the middle of the heart is defined as the negative lead (i.e., the two arm leads are connected together). The axes of these leads form angles of +90 degrees for aVF, -30 degrees for aVL, and -150 degrees for aVR (all with respect to the horizontal axis). Finally, leads can be applied to the surface of the chest, so-called precordial leads, to determine the
projections of the cardiac vector on the sagittal and transverse planes of the body. These precordial leads are recorded from six selected points on the anterior and lateral surfaces of the chest in the vicinity of the heart. The leads extend from the right border of the sternum in the fourth intercostal space (V1) to under the left arm (midaxillary line) in the fifth intercostal space (V6). Each precordial lead (V1 to V6) is defined as a positive lead, whereas the middle of the heart is defined as the negative lead. Detailed analysis of the ECG, as detected by the various lead systems just described, is beyond the scope of this book. Interested students are referred to textbooks on electrocardiography for more information.
|
| Cardiac arrhythmias are disturbances in either impulse initiation or impulse propagation. Disturbances in impulse initiation include those that arise from the SA node and those that originate from various ectopic foci. The principal disturbances in impulse propagation are conduction blocks and reentrant rhythms.
|
| Altered Sinoatrial Rhythms
|
| Mechanisms that vary the firing frequency of cardiac pacemaker cells were described previously. Changes in the firing rate of the SA node are usually produced by the cardiac autonomic nerves. When the firing rate of the SA node is decreased, the heart rate also decreases (bradycardia). Conversely, increased SA node firing results in an elevated heart rate (tachycardia). Examples of ECGs of sinus tachycardia and sinus bradycardia are shown in Figure 16-29. The P, QRS, and T deflections are all normal, but cardiac cycle duration (the PP interval) is altered. Characteristically, cardiac frequency changes gradually. A rhythmic variation of the PP interval at the respiratory frequency (i.e., a respiratory sinus arrhythmia) is a normal, common occurrence.
|
| Atrioventricular Conduction Blocks
|
| Various physiological, pharmacological, and pathological processes can impede transmission of an impulse through the AV node. The site of block can be localized more precisely by recording the His bundle electrogram (Fig. 16-30). To obtain such tracings, an electrode catheter is introduced into a peripheral vein and threaded centrally into the right side of the heart until the electrode lies in the AV junctional region. When the electrode is properly positioned, a distinct deflection (H in Fig. 16-30) is registered as the cardiac impulse passes through the bundle of His. The time intervals required for propagation from the atrium to the bundle of His (A-H interval) and from the bundle of His to the ventricles (H-V interval) may be measured accurately. Abnormal prolongation of the A-H or H-V interval indicates block above or below the bundle of His, respectively.
|
| Figure 16-29 A to C, Sinoatrial rhythms. |
| page 313 | | | page 314 |
| Figure 16-30 His bundle electrogram (lower tracing, retouched) and lead II of the scalar electrocardiogram (upper tracing). The deflection H, which represents conduction of the impulse over the bundle of His, is clearly visible between the atrial (A) and the ventricular (V) deflections. The conduction time from the atria to the bundle of His is denoted by the A-H interval, and that from the bundle of His to the ventricles, by the H-V interval. (Courtesy of Dr. J. Edelstein.) |
| Three degrees of AV block can be distinguished, as shown in Figure 16-31. First-degree AV block is characterized by a prolonged PR interval. In most cases of first-degree block, the A-H interval is prolonged and the H-V interval is normal. Hence, the delay in a first-degree AV block is located above the His bundle (i.e., in the AV node). |
| In second-degree AV block, all QRS complexes are preceded by P waves, but not all P waves are followed by QRS complexes. The ratio of P waves to QRS complexes is usually the ratio of two small integers (such as 2:1, 3:1, or 3:2). The site of block may be located above or below the His bundle. A block below the bundle is usually more serious than one above the bundle because the former is more likely to evolve into a third-degree block. An artificial pacemaker is frequently implanted when the block is below the bundle. |
| Third-degree AV block is often referred to as complete heart block because the impulse is completely unable to traverse the AV conduction pathway from atria to ventricles. The most common sites of complete block are distal to the bundle of His. In complete heart block, the atrial and ventricular rhythms are entirely independent. Because of the slow ventricular rhythm that results, the volume of blood pumped by the heart is often inadequate, especially during muscular exercise. Third-degree block is frequently associated with syncope (pronounced lightheadedness), which is caused principally by insufficient cerebral blood flow. Third-degree block is one of the most common conditions that require artificial pacemakers. |
| Premature Depolarizations
|
| Premature depolarizations occur occasionally in most normal individuals, but they arise more commonly in certain abnormal conditions. Such depolarizations may originate in the atria, AV junction, or ventricles. One type of premature depolarization follows a normally conducted depolarization at a constant time interval (the coupling interval). If the normal depolarization is suppressed in some way (e.g., by vagal stimulation), the premature depolarization is also abolished. Such premature depolarizations are called coupled extrasystoles, or simply extrasystoles, and they generally reflect a reentry phenomenon. A second type of premature depolarization occurs as the result of enhanced automaticity in some ectopic focus. This ectopic center may fire regularly, and a zone of tissue that conducts unidirectionally may protect this center from being depolarized by the normal cardiac impulse. If this premature depolarization occurs at a regular interval or at an integral multiple of that interval, the disturbance is called parasystole.
|
| A premature atrial depolarization is shown in Figure 16-32, A. With a premature atrial depolarization, the normal interval between beats is shortened. In addition, the configuration of the premature P wave differs from that of the other normal P waves because the course of atrial excitation, which originates at some ectopic focus in the atrium, differs from the normal spread of excitation, which originates at the SA node. The QRS complex of the premature depolarization is generally normal because the ventricular excitation spreads over the usual pathways.
|
| A premature ventricular depolarization is shown in Figure 16-32, B. Propagation of the impulse is abnormal, and the configuration of the QRS complex and T wave is entirely different from the normal ventricular deflections because the premature excitation originates at some ectopic focus in the ventricles. The time interval between the premature QRS complex and the preceding normal QRS complex is shortened, whereas the interval after the premature QRS complex and the next normal QRS complex is prolonged. The interval from the QRS complex just before the premature excitation to the QRS complex just after it is virtually equal to the duration of two normal cardiac cycles.
|
| As noted, a compensatory pause usually follows a premature ventricular depolarization. This pause occurs because the ectopic ventricular impulse does not disturb the natural rhythm of the SA node, either because the ectopic ventricular impulse is not conducted retrograde through the AV conduction system or because the SA node had already fired at its natural interval before the ectopic impulse could have reached and depolarized it prematurely. Likewise, the SA nodal impulse generated just before or after the ventricular extrasystole generally does not affect the ventricle because the AV junction and perhaps also the ventricles are still refractory from the premature ventricular excitation.
|
| page 314 | | | page 315 |
| Figure 16-31 AV blocks. A, First-degree block; the PR interval is 0.28 second (normal, <0.20 sec). B, Second-degree block (2:1). C, Third-degree block; note the dissociation between the P waves and the QRS complexes. |
| Figure 16-32 Premature atrial depolarization (A) and premature ventricular depolarization (B). The premature atrial depolarization (the second beat in A) is characterized by an inverted P wave and normal QRS complexes and T waves. The interval after the premature depolarization is not much longer than the usual interval between beats. The brief rectangular deflection just before the last depolarization is a standardization signal. The premature ventricular depolarization is characterized by bizarre QRS complexes and T waves and is followed by a compensatory pause. |
| Paroxysmal tachycardias that originate either in the atria or in the AV junctional tissues (Fig. 16-33, A) are usually indistinguishable, and therefore both are included in the term paroxysmal supraventricular tachycardia. In this tachycardia, the impulse often circles a reentry loop that includes atrial and AV junctional tissue. The QRS complexes are frequently normal because ventricular activation proceeds over the usual pathways. |
| As its name implies, paroxysmal ventricular tachycardia originates from an ectopic focus in the ventricles. The ECG is characterized by repeated, bizarre QRS complexes that reflect the abnormal intraventricular impulse conduction (Fig. 16-33, B). Paroxysmal ventricular tachycardia is much more ominous than supraventricular tachycardia because the former is frequently a precursor of ventricular fibrillation, a lethal arrhythmia described in the next section. |
| page 315 | | | page 316 |
| In contrast to the gradual rate changes that characterize sinus tachycardia, tachycardias that originate from
an ectopic focus typically begin and end abruptly. Such ectopic tachycardias are generally called paroxysmal tachycardias. Episodes of paroxysmal tachycardia may persist for only a few beats or for many hours or days, and episodes often recur. Paroxysmal tachycardias may result from (1) rapid firing of an
ectopic pacemaker, (2) triggered activity secondary to afterpotentials that reach threshold, or (3) an impulse that circles a reentry loop repetitively.
|
| Under certain conditions, cardiac muscle undergoes an irregular type of contraction that is entirely ineffectual in propelling blood. Such an arrhythmia is termed fibrillation, and the disturbance may involve either the atria or the ventricles. Fibrillation probably represents a reentry phenomenon in which the reentry loop fragments into multiple, irregular circuits.
|
| Figure 16-33 A and B, Paroxysmal tachycardias. |
| Figure 16-34 Atrial and ventricular fibrillation. |
| The electrocardiographic changes in atrial fibrillation are shown in Figure 16-34, A. This arrhythmia occurs in various types of chronic heart disease. The atria do not contract and relax sequentially during each cardiac cycle, and thus they do not contribute to
ventricular filling. Instead, the atria undergo a continuous, uncoordinated rippling motion. P waves do not appear on the ECG, and they are replaced by continuous irregular fluctuations in potential called f waves. The AV node is activated at intervals that may vary considerably from cycle to cycle. Hence, no constant interval occurs between successive QRS complexes or between successive ventricular contractions. Because the strength of ventricular contraction depends on the interval between beats (see Chapter 18), the volume and rhythm of the pulse are irregular. In many patients, the atrial reentry loop and the pattern of AV conduction are more regular than they are in atrial fibrillation. The rhythm is then referred to as atrial flutter.
|
| Atrial fibrillation and flutter are not usually life-threatening; some people with these disturbances can function normally. However, because the atria do not contract and relax rhythmically, blood clots tend to form in the atria. Such clots, if dislodged, may then travel to the pulmonary or systemic vascular beds. Patients with atrial fibrillation or flutter are generally treated with anticoagulant drugs such as dicumarol to prevent the formation of such clots. |
| Ventricular fibrillation, in contrast, leads to loss of consciousness within a few seconds. The irregular, continuous, uncoordinated twitching of the ventricular muscle fibers pumps no blood. Death ensues unless immediate effective resuscitation is achieved or the rhythm spontaneously reverts to normal, which rarely occurs. Ventricular fibrillation may supervene when the entire ventricle, or some portion of it, is deprived of its normal blood supply. It may also occur as a result of electrocution or in response to certain drugs and anesthetics. On the ECG (Fig. 16-34, B), the fluctuations in potential are highly irregular. |
| page 316 | | | page 317 |
| In some individuals the interval between the QRS complex and the T wave is abnormally prolonged, a conditioned termed long QT syndrome (Fig. 16-35). Several congenital forms of long QT syndrome have been identified in human subjects. Two of the many genes that have been identified as the basis for this syndrome are the HERG gene (a K+ channel gene), located on chromosome 7, and the SCN5A gene (a Na+ gene), located on chromosome 3. Patients with congenital forms of long QT syndrome may have periodic episodes of syncope (fainting), and about 10% of pediatric subjects with this disorder may die suddenly, without any preceding symptoms. Long QT syndrome may also be acquired inasmuch as a subtle genetic change is not evident until a drug is taken that affects the ion channel involved. Many drugs, including several antiarrhythmic agents, have been identified as causing acquired long QT syndrome. |
|
| Ventricular fibrillation is often initiated when a premature impulse arrives during the vulnerable period of the cardiac cycle. This period coincides with the downslope of the T wave of the ECG. During this period the excitability of cardiac cells varies spatially. Some fibers are still in their effective refractory periods, others have almost fully recovered their excitability, and still others are able to conduct impulses, but only at very slow conduction velocities. Consequently, the action potentials are propagated over the chambers in many irregular wavelets that travel along circuitous paths and at various conduction velocities. As a region of cardiac cells becomes excitable again, it is ultimately reentered by one of the wave fronts traveling around the chamber. Hence, the process is self-sustaining.
|
| Atrial fibrillation may be changed to a normal sinus rhythm by drugs that prolong the refractory period. As the cardiac impulse completes the reentry loop, it may then encounter refractory myocardial fibers. When atrial fibrillation does not respond adequately to drugs, electrical defibrillation may be used to correct this condition.
|
| Dramatic therapy is required for ventricular fibrillation. Conversion to a normal sinus rhythm is accomplished by means of a strong electrical current that places the entire myocardium briefly in a refractory state. Techniques have been developed to administer the current safely through the intact chest wall. In successful cases, the SA node again takes over the normal pacemaker function for the entire heart.
|
| Figure 16-35 Electrocardiograms recorded from a normal subject (A) and from a patient with long QT syndrome (B). |
| Implantable cardioverter-defibrillator (ICD) devices have recently been developed to prevent death in patients in whom either ventricular fibrillation or paroxysmal ventricular tachycardia has suddenly developed. The former is lethal unless it is treated immediately, and the latter often leads to ventricular fibrillation and sudden death. The ICD device is implanted subcutaneously in the left subclavicular region of the chest wall. Atrial and ventricular leads permit recording of the right atrial and right ventricular electrograms and provide the ability for right atrial or right ventricular pacing, or both. The defibrillation coil in the right atrium permits the application of a strong electrical current to the ventricle and thereby usually terminates the lethal arrhythmia. |
|
| The great amount of work performed by the heart over an individual's lifetime is impressive. A useful way to understand how the heart accomplishes its important
task is to consider the relationships between the structure and function of its components.
|
| Relationship of Heart Structure to Function
|
| Many important morphological and functional differences and similarities exist between myocardial and skeletal muscle cells (see Chapters 12 and 13). Importantly, both are striated as a result of regular arrangement of the contractile proteins actin and myosin, and generation of force and contraction of muscle fiber occur as a result of their interactions (i.e., sliding filament mechanism).
|
| page 317 | | | page 318 |
| Figure 16-36 Relationship of myocardial resting fiber length (sarcomere length) or end-diastolic volume to the force developed or peak systolic ventricular pressure during ventricular contraction in an intact heart. (Redrawn from Patterson SW et al: J Physiol 48:465, 1914.) |
| Skeletal muscle and cardiac muscle show similar length-force relationships. This relationship for the heart may be expressed graphically, as in Figure 16-36,
by substituting ventricular systolic pressure for force and end-diastolic ventricular volume for resting myocardial fiber (and hence sarcomere) length. The lower curve in Figure 16-36 represents the increment in pressure produced by each increment in volume when the heart is in diastole. The upper curve represents the peak pressure developed by the ventricle during systole as a function of filling pressure. This curve illustrates the Frank-Starling relationship (also called Starling's law of the heart).
|
| The pressure-volume curve during diastole is initially quite flat (compliant), which indicates that large increases in volume can be accommodated with only small increases in pressure. In contrast, the development of systolic pressure is considerable at the lower filling pressures. However, the ventricle becomes much less distensible with greater filling, as evidenced by the sharp rise in the diastolic pressure curve at large intraventricular volumes.
|
| In a normal intact heart, peak force may be attained at a filling pressure of about 12 mm Hg. At this intraventricular diastolic pressure, which is near the upper limit observed in a normal heart, sarcomere length is near its resting length of 2.2 μm. However, the force developed peaks at filling pressures as high as 30 mm Hg. At even higher diastolic pressures (>50 mm Hg), sarcomere length is not greater than 2.6 μm. This ability of the myocardium to resist stretch at high filling pressures probably resides in the noncontractile constituents of the heart tissue (connective tissue), and it may serve as a safety factor against overloading of the heart in diastole. Usually, ventricular diastolic pressure is about 0 to 7 mm Hg, and the average diastolic sarcomere length is about 2.2 μm. Thus, a normal heart operates on the ascending portion of the Frank-Starling curve depicted in Figure 16-36.
|
| Cardiac muscle functions as a syncytium; that is, a stimulus applied to any part of the cardiac muscle results in contraction of the entire muscle. Gap junctions with high conductance are present in the intercalated disks between adjacent cells and facilitate conduction of the cardiac impulse from one cell to the next.
|
| Cardiac muscle must contract repetitively for a lifetime, and hence it requires a continuous supply of O2. Cardiac muscle is therefore very rich in mitochondria. The large number of mitochondria, which have the enzymes necessary for oxidative phosphorylation, permits rapid oxidation of substrates and synthesis of ATP and thus sustains the myocardial energy requirements.
|
| To provide adequate O2 and substrate for its metabolic machinery, the myocardium is also endowed with a rich capillary supply, about one capillary per fiber. Thus, diffusion distances are short, and O2, CO2, substrates, and waste material can move rapidly between the myocardial cell and capillary. The transverse (T) tubular system within myocardial cells participates in this exchange of substances between capillary blood and myocardial cells (as described later, the T tubule system also plays a key role in excitation-contraction coupling). The T tubular system is absent or poorly developed in the atrial cells of many mammals.
|
| Excitation-Contraction Coupling
|
| The earliest studies on isolated hearts indicated that optimal concentrations of Na+, K+, and Ca++ in extracellular fluid are necessary for contraction of cardiac muscle. Without Na+, the heart is not excitable and will not beat. As already described, the resting membrane potential is independent of the [Na+]o gradient across the membrane, but very much dependent on [K+]o. Decreases or increases in [K+]o, especially if they are large or occur quickly, can lead to arrhythmias, loss of excitability of the myocardial cells, and even cardiac arrest. Ca++ is also essential for cardiac contraction. Removal of Ca++ from the extracellular fluid results in decreased contractile force and eventual arrest in diastole. Conversely, an increase in [Ca++]o enhances contractile force, and very high [Ca++]o induces cardiac arrest in systole (rigor). The free intracellular [Ca++] is the factor principally responsible for the contractile state of the myocardium.
|
| page 318 | | | page 319 |
| The process by which the action potential of the cardiac myocyte leads to contraction is termed excitation-contraction coupling (see also Chapter 13). Cardiac muscle is excited when a wave of excitation spreads rapidly along the myocardial sarcolemma from cell to cell via gap junctions. Excitation also spreads into the interior of the cells via the T tubules, which invaginate the cardiac fibers at the Z lines. Electrical stimulation at the Z line or the application of Ca++ to the Z lines in a skinned (sarcolemma removed) cardiac fiber elicits localized contraction of the adjacent myofibrils. During the plateau (phase 2) of the action potential, permeability of the sarcolemma to Ca++ increases. Ca++ flows down its electrochemical gradient and enters the cell through Ca++ channels in the sarcolemma and in the T tubules.
|

|
| Figure 16-37 Schematic diagram of the movement of calcium in excitation-contraction coupling in cardiac muscle. Influx of Ca++ from interstitial fluid during excitation triggers release of Ca++ from the sarcoplasmic reticulum (SR). The free cytosolic Ca++ activates contraction of the myofilaments (systole). Relaxation (diastole) occurs as a result of uptake of Ca++ by the SR, by extrusion of intracellular Ca++ by the 3Na+-1Ca++ antiporter, and to a limited degree by the Ca++-ATPase pump. βR, β-adrenergic receptor; cAMP-PK, cAMP-dependent protein kinase. |
| During the action potential Ca++ enters the cell via Ca++ channels (e.g., L type). However, the amount of Ca++ that enters the cell interior from the extracellular/interstitial fluid is not sufficient to induce contraction of the myofibrils. Instead, it acts as a trigger (trigger Ca++) to release Ca++ from the SR, where the intracellular Ca++ is stored (Fig. 16-37). Ca++ leaves the SR through Ca++ release channels, which are called ryanodine receptors because the channel protein,
also called foot protein or junctional processes, binds ryanodine avidly. Cytoplasmic [Ca++] increases from a resting level of about 10-7 M to levels of about 10-5 M during excitation. This Ca++ then binds to the protein troponin C. The Ca++-troponin complex interacts with tropomyosin to unblock active sites between the actin and myosin filaments. This unblocking initiates cross-bridge cycling and hence contraction of the myofibrils.
|
| page 319 | | | page 320 |
| Mechanisms that raise cytosolic [Ca++] increase the force developed, and those that lower cytosolic [Ca++] decrease the force developed. For example, catecholamines increase the movement of Ca++ into the cell by phosphorylation of the sarcolemmal Ca++ channels via a cAMP-dependent protein kinase. This in turn releases more Ca++ from the SR, and as a result contractile force increases. Increasing [Ca++]o will increase the amount of Ca++ that enters the cell via the Ca++ channels and will thereby increase contractile force as just described. Reducing the Na+ gradient across the sarcolemma will also increase contractile force, an effect mediated by the 3Na+-1Ca++ antiporter that normally extrudes Ca++ from the cell (Fig. 16-37). For example, reducing [Na+]o causes less Na+ to enter the cell in exchange for Ca++, which results in an increase in [Ca++]i and thus
contractile force. Raising [Na+]i will have a similar effect. Indeed, this is the mechanism by which cardiac glycosides increase contractile force. Cardiac glycosides inhibit Na+,K+-ATPase and thereby raise [Na+]i in the cells. The elevated cytosolic [Na+] reverses the direction of the 3Na+-1Ca++ antiporter, and therefore less Ca++ is removed from the cell. The increase in [Ca++]i results in an increase in contractile force. Finally, contractile force is diminished when [Ca++]i is decreased by a reduction in [Ca++]o, by an increase in the Na+ gradient across the sarcolemma, or by the administration of a Ca++ channel antagonist that prevents Ca++ from entering the myocardial cell.
|
| At the end of systole, the influx of Ca++ stops, and the SR is no longer stimulated to release Ca++. In fact, the SR avidly takes up Ca++ by means of a Ca++-ATPase. This SR Ca++-ATPase is similar to but distinct from the Ca++-ATPase found in the sarcolemma. Cytosolic [Ca++] is also reduced during diastole through the action of the 3Na+-1Ca++ antiporter in the sarcolemma, as well as by a sarcolemmal Ca++-ATPase (Fig. 16-37).
|
| Cardiac contraction and relaxation are both accelerated by catecholamines. When catecholamines bind to their receptor (β1-adrenoceptor), adenylyl cyclase is activated, thereby increasing intracellular cAMP levels, which then leads to activation of cAMP-dependent protein kinase A (PKA). PKA has multiple effects in the cell. As already described, it phosphorylates the Ca++ channel in the sarcolemma and causes increased entry of Ca++ into the cell, thus increasing the force of contraction. In addition, PKA phosphorylates other proteins that facilitate relaxation. One such protein is phospholamban. Phospholamban normally inhibits the SR Ca++-ATPase. However, when phosphorylated, the inhibitory action of phospholamban is reduced, and uptake of Ca++ into the SR is enhanced. The increased activity of the SR Ca++-ATPase decreases [Ca++]i, thereby causing relaxation. PKA also phosphorylates troponin I, which in turn inhibits binding of Ca++ by troponin C. As a result, tropomyosin returns to its position of blocking the myosin binding sites on the actin filaments, and relaxation results.
|
| Myocardial Contractile Machinery and Contractility
|
| Contraction of cardiac muscle is influenced by both preload and afterload (Fig. 16-38). Preload refers to the force that stretches the relaxed muscle fibers. In the left ventricle, for example, the blood filling and thus stretching the wall during diastole represents the preload. Afterload refers to the force against which the contracting muscle must act. Again from the perspective of the left ventricle, afterload is the pressure in the aorta that must be overcome by the contracting left ventricular muscle to open the aortic valve and eject the blood.
|
| Preload can be increased by greater filling of the left ventricle during diastole (i.e., increasing end-diastolic volume). At lower end-diastolic volumes, increments in filling pressure during diastole elicit a greater systolic pressure during the subsequent contraction. Systolic pressure increases until a maximal systolic pressure is reached at the optimal preload (Fig. 16-36). If diastolic filling continues beyond this point, no further increase in the pressure developed will occur. At very high filling pressures, peak pressure development in systole is actually reduced.
|
| At a constant preload, higher systolic pressure can be reached during ventricular contractions by raising the afterload (e.g., increasing aortic pressure by restricting the runoff of arterial blood to the periphery). Incremental increases in afterload produce progressively higher peak systolic pressures. However, if the afterload continues to increase, it becomes so great that the ventricle can no longer generate enough force to open the aortic valve. At this point, ventricular systole is totally isometric (i.e., there is no ejection of blood), and thus no change occurs in ventricular volume during systole. The maximal pressure developed by the left ventricle under these conditions is the maximal isometric force that the ventricle is capable of generating at a given preload. At preloads below the optimal filling volume, an increase in preload can yield greater maximal isometric force (Fig. 16-36).
|
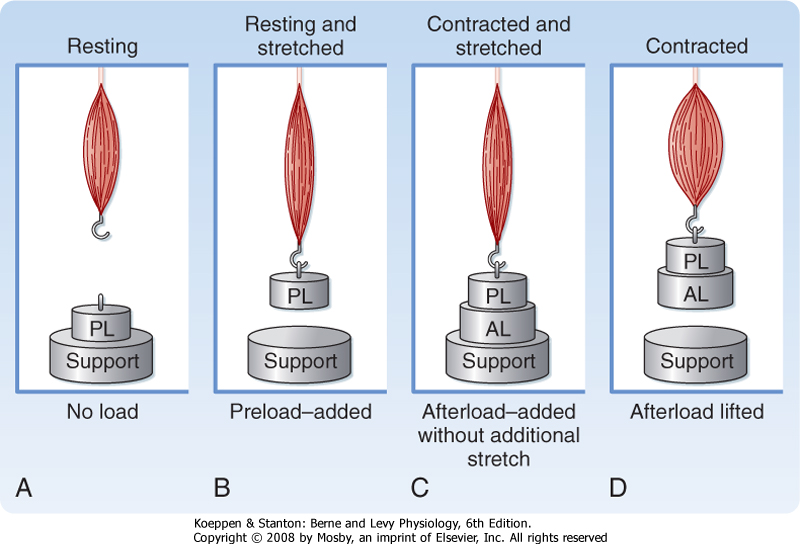
|
| Figure 16-38 Preload and afterload in a papillary muscle. A, Resting stage-in the intact heart just before opening of the AV valves. B, Preload-in the intact heart at the end of ventricular filling. C, Supported preload plus afterload-in the intact heart just before opening of the aortic valve. D, Lifting preload plus afterload-in the intact heart, ventricular ejection with a decrease in ventricular volume. AL, afterload; PL, preload; PL + AL, total load. |
| page 320 | | | page 321 |
| In an intact animal, preload and afterload depend on certain characteristics of the vascular system and the behavior of the heart. With respect to the vasculature, the degree of venomotor tone and peripheral resistance influences preload and afterload. With respect to the heart, a change in rate or stroke volume can also alter preload and afterload. Hence, cardiac and vascular factors interact with each other to affect preload and afterload (see Chapter 19).
|
| Contractility defines cardiac performance at a given preload and afterload. Contractility determines the change in peak isometric force (isovolumic pressure) at a given initial fiber length (end-diastolic volume). Contractility can be augmented by certain drugs, such as norepinephrine or digitalis, or by an increase in contraction frequency (tachycardia). The increase in contractility (positive inotropic effect) produced by these interventions is reflected by incremental increases in the force developed and in the velocity of contraction.
|
| Figure 16-39 Left ventricular pressure curves with tangents drawn to the steepest portions of the ascending limbs to indicate maximal dP/dt values. A, control; B, hyperdynamic heart, as with administration of norepinephrine; C, hypodynamic heart, as in cardiac failure. |
| A reasonable index of myocardial contractility can be derived from the contour of ventricular pressure curves (Fig. 16-39). A hypodynamic heart is characterized by an elevated end-diastolic pressure, slowly rising ventricular pressure, and a somewhat reduced ejection phase (curve C, Fig. 16-39). A hyperdynamic heart (curve B, Fig. 16-39) shows reduced end-diastolic pressure, fast-rising ventricular pressure, and a brief ejection phase. The slope of the ascending limb of the ventricular pressure curve indicates the maximal rate
of force development by the ventricle. The maximal rate of change in pressure with time, that is, the maximum dP/dt, is illustrated by the tangents to the steepest portion of the ascending limbs of the ventricular pressure curves in Figure 16-39. The slope of the ascending limb is maximal during the isovolumic phase of systole (Fig. 16-40). At any given degree of ventricular filling, the slope provides an index of the initial contraction velocity and hence an index of contractility.
|
| Similarly, the contractile state of the myocardium can be obtained from the velocity of blood flow that occurs initially in the ascending aorta during the cardiac cycle (Fig. 16-40). In addition, the ejection fraction, which is the ratio of the volume of blood ejected from the left ventricle per beat (stroke volume) to the volume of blood in the left ventricle at the end of diastole (end-diastolic volume), is widely used clinically as an index of contractility.
|
| The atria are thin-walled, low-pressure chambers that function more as large-reservoir conduits of blood for their respective ventricles than as important pumps for the forward propulsion of blood. The ventricles comprise a continuum of muscle fibers originating from the fibrous skeleton at the base of the heart (chiefly around the aortic orifice). These fibers sweep toward the cardiac apex at the epicardial surface. They pass toward the endocardium and gradually undergo a 180-degree change in direction to lie parallel to the epicardial fibers and to form the endocardium and papillary muscles.
|
| At the apex of the heart, the fibers twist and turn inward to form papillary muscles. At the base of the heart and around the valve orifices, these myocardial fibers form a thick, powerful muscle mass that not only decreases the ventricular circumference to implement the ejection of blood but also narrows the AV valve orifices as an aid to closure of valve. Ventricular ejection is also accomplished by decreasing the longitudinal axis as the heart begins to narrow toward the base. The early contraction of the apical part of the ventricles, coupled with the approximation of the ventricular walls, propels the blood toward the ventricular outflow tracts. The right ventricle, which develops a mean pressure that is about a seventh that developed by the left ventricle, is considerably thinner than the left ventricle.
|
| The cardiac valve leaflets consist of thin flaps of flexible, tough, endothelium-covered fibrous tissue that are firmly attached at the base to the fibrous valve rings. Movement of the valve leaflets is essentially passive, and the orientation of the cardiac valves is responsible for the unidirectional flow of blood through the heart. There are two types of valves in the heart: atrioventricular and semilunar valves (Figs. 16-41 and 16-42).
|
| page 321 | | | page 322 |
| Figure 16-40 Left atrial, aortic, and left ventricular pressure pulses correlated in time with aortic flow, ventricular volume, heart sounds, venous pulse, and the electrocardiogram for a complete cardiac cycle. |
| The tricuspid valve, located between the right atrium and the right
ventricle, is made up of three cusps, whereas the mitral valve, which lies between the left atrium and the left ventricle, has two cusps. The total area of the cusps of each AV valve is approximately twice that of the respective AV orifice, so considerable overlap of the leaflets occurs when the valves are in the closed position. Attached to the free edges of these valves are fine, strong ligaments (chordae tendineae) that arise from the powerful papillary muscles of the respective ventricles. These ligaments prevent the valves from becoming everted during ventricular systole.
|
| In a normal heart, the valve leaflets remain relatively close together during ventricular filling. The partial approximation of the valve surfaces during diastole is caused by eddy currents that prevail behind the leaflets and by tension that is exerted by the chordae tendineae and papillary muscles.
|
| The pulmonic and aortic valves are located between the right ventricle and the pulmonary artery and between the left ventricle and the aorta, respectively. These valves consist of three cup-like cusps that are attached to the valve rings (Figs. 16-41 and 16-42). At the end of the reduced ejection phase of ventricular systole, blood flow briefly reverses toward the ventricles. This reversal of blood flow snaps the cusps together and prevents regurgitation of blood into the ventricles. During ventricular systole, the cusps do not lie back against the walls of the pulmonary artery and aorta but instead float in the bloodstream at a point approximately midway between the vessel walls and their closed position. Behind the semilunar valves are small outpocketings (sinuses of Valsalva) of the pulmonary artery and aorta. In these sinuses, eddy currents develop that tend to keep the valve cusps away from the vessel walls. Furthermore, the orifices of the right and left coronary arteries are behind the right and the left cusps, respectively, of the aortic valve. Were it not for the presence of the sinuses of Valsalva and the eddy currents developed therein, the coronary ostia could be blocked by the valve cusps and coronary blood flow would cease.
|
| The pericardium invests the entire heart and the cardiac portion of the great vessels, and it is reflected onto the cardiac surface as the epicardium. The sac normally contains a small amount of fluid, which provides lubrication for the continuous movement of the enclosed heart. The pericardium is not very distensible, and therefore it strongly resists a large, rapid increase in cardiac size. Hence, the pericardium prevents sudden overdistention of the chambers of the heart. However, in congenital absence of the pericardium or after its surgical removal, cardiac function is not seriously affected. Nevertheless, with the pericardium intact, an increase in diastolic pressure in one ventricle increases the pressure and decreases the compliance of the other ventricle.
|
| page 322 | | | page 323 |
| Figure 16-41 Drawing of a heart split perpendicular to the interventricular septum to illustrate the anatomic relationships of the leaflets of the atrioventricular and aortic valves. |
| Figure 16-42 Four cardiac valves as viewed from the base of the heart. Note how the leaflets overlap in the closed valves. |
| Four sounds are usually generated by the heart, but only two are ordinarily audible through a stethoscope.
With electronic amplification, the less intense sounds can be detected and recorded graphically as a phonocardiogram. This means of registering faint heart sounds helps delineate the precise timing of the heart sounds relative to other events in the cardiac cycle.
|
| The first heart sound is initiated at the onset of ventricular systole (Fig. 16-43) and reflects closure of the AV valves. It is the loudest and longest of the heart sounds, has a crescendo-decrescendo quality, and is heard best over the apical region of the heart. The tricuspid valve sounds are heard best in the fifth intercostal space just to the left of the sternum; the mitral sounds are heard best in the fifth intercostal space at the cardiac apex.
|
| page 323 | | | page 324 |
| Figure 16-43 Phonocardiogram illustrating the first and second heart sounds and their relationship to the P, R, and T waves of the electrocardiogram. Time lines = 0.04 second. |
| The second heart sound, which occurs with abrupt closure of the semilunar valves (Fig. 16-43), is composed of higher-frequency vibrations (higher pitch) and is of shorter duration and lower intensity than the first heart sound. The portion of the second sound caused by closure of the pulmonic valve is heard best
in the second thoracic interspace just to the left of the sternum, whereas that caused by closure of the aortic valve is heard best in the same intercostal space but to the right of the sternum. The aortic valve sound is generally louder than the pulmonic, but in cases of pulmonary hypertension the reverse is true. The nature of the second heart sound changes with respiration. During expiration, a single heart sound is heard that reflects simultaneous closing of the pulmonic and aortic valves. However, during inspiration, closure of the pulmonic valve is delayed, mainly as a result of increased blood flow from an inspiration-induced increase in venous return.* With this delayed closure of the pulmonic valve the second heart sound can be resolved into two components; this is termed physiological splitting of the second heart sound.
|
| A third heart sound is sometimes heard in children with thin chest walls or in patients with left ventricular failure. It consists of a few low-intensity, low-frequency vibrations heard best in the region of the cardiac apex. The vibrations occur in early diastole and are caused by the abrupt cessation of ventricular distention and by the deceleration of blood entering the ventricles. A fourth, or atrial, sound consists of a few low-frequency oscillations. This sound is occasionally heard in normal individuals. It is caused by the oscillation of blood and cardiac chambers as a result of atrial contraction.
|
| In overloaded hearts, as in congestive heart failure, when ventricular volume is very large and the ventricular walls are stretched maximally, a third heart sound is often heard. A third heart sound in patients with heart disease is usually a grave sign. When the third and fourth (atrial) sounds are accentuated, as occurs in certain abnormal conditions, triplets of sounds resembling the sound of a galloping horse (called gallop rhythms) may occur. |
| Mitral insufficiency and mitral stenosis produce, respectively, systolic and diastolic murmurs that are heard best at the cardiac apex. Aortic insufficiency and aortic stenosis, in contrast, produce, respectively, diastolic and systolic murmurs that are heard best in the second intercostal space just to the right of the sternum. The characteristics of the murmurs serve as an important guide in the diagnosis of valvular disease. |
| The phase between the start of ventricular systole and opening of the semilunar valves (when ventricular pressure rises abruptly) is called the isovolumic (literally, "same volume") contraction period. This term is appropriate because ventricular volume remains constant during this brief
period (Fig. 16-40). The onset of isovolumetric contraction also coincides with the peak of the R wave on an ECG, initiation of the first heart sound, and the earliest rise in ventricular pressure on the ventricular pressure curve after atrial contraction.
|
| Opening of the semilunar valves marks the onset of the ventricular ejection phase, which may be subdivided into an earlier, shorter phase (rapid ejection) and a later, longer phase (reduced ejection). The rapid ejection phase is distinguished from the reduced ejection phase by three characteristics: (1) a sharp rise in ventricular and aortic pressure that terminates at peak ventricular and aortic pressure, (2) an abrupt decrease in ventricular volume, and (3) a pronounced increase in aortic blood flow (Fig. 16-40). The sharp decrease in left atrial pressure seen at the onset of ventricular ejection results from descent of the base of the heart and consequent stretching of the atria. During the reduced ejection period, runoff of blood from the aorta to the peripheral blood vessels exceeds the rate of ventricular output, and therefore aortic pressure declines. Throughout ventricular systole, the blood returning from the peripheral veins to the atria produces a progressive increase in atrial pressure.
|
| Note that during the rapid ejection period, left ventricular pressure slightly exceeds aortic pressure and aortic blood flow accelerates (continues to increase), whereas during the reduced ventricular ejection phase, the reverse holds true. This reversal of the ventricular-aortic pressure gradient in the presence of continuous flow of blood from the left ventricle to the aorta is the result of storage of potential energy in the stretched arterial walls. This stored potential energy decelerates blood flow from the left ventricle into the aorta. The peak of the flow curve coincides with the point at which the left ventricular pressure curve intersects the aortic pressure curve during ejection. Thereafter, flow decelerates (continues to decrease) because the pressure gradient has been reversed.
|
| page 324 | | | page 325 |
| Figure 16-40 shows a tracing of a venous pulse curve recorded from a jugular vein. Three waves are apparent. The a wave occurs with the rise in pressure caused by atrial contraction. The c wave in this tracing is caused by impact of the common carotid artery with the adjacent jugular vein and to some extent by the abrupt closure of the tricuspid valve in early ventricular systole. Finally, the v wave reflects the rise in pressure associated with atrial filling. Note that except for the c wave, the venous pulse closely follows the left atrial pressure curve.
|
| At the end of ventricular ejection, a volume of blood approximately equal to that ejected during systole remains in the ventricular cavities. This residual volume is fairly constant in normal hearts. However, residual volume decreases somewhat when the heart rate increases or when peripheral vascular resistance has diminished.
|
| Closure of the aortic valve produces the characteristic incisura (notch) on the descending limb of the aortic pressure curve, and it also produces the second heart sound (with some vibrations evident on the atrial pressure curve). The incisura marks the end of ventricular systole. The period between closure of the semilunar valves and opening of the AV valves is termed isovolumic relaxation. It is characterized by a precipitous fall in ventricular pressure without a change in ventricular volume.
|
| The major portion of ventricular filling occurs immediately after opening of the AV valves. At this point the blood that had returned to the atria during the previous ventricular systole is abruptly released into the relaxing ventricles. This period of ventricular filling is called the rapid filling phase. In Figure 16-40 the onset of the rapid filling phase is indicated by the decrease in left ventricular pressure below left atrial pressure. This pressure reversal opens the mitral valve. The rapid flow of blood from atria to relaxing ventricles produces a transient decrease in atrial and ventricular pressure and a sharp increase in ventricular volume.
|
| An increase in myocardial contractility, as produced by catecholamines or by digitalis in a patient with a failing heart, may decrease residual ventricular volume and increase the stroke volume and ejection fraction. In severely hypodynamic and dilated hearts, residual volume can become much greater than stroke volume. |
| The rapid ventricular filling phase is followed by a phase of slow ventricular filling called diastasis. During diastasis, blood returning from the peripheral veins flows into the right ventricle and blood from the lungs flows into the left ventricle. This
small, slow addition to ventricular filling is indicated by a gradual rise in atrial, ventricular, and venous pressure and ventricular volume (Fig. 16-40).
|
| The onset of atrial systole occurs soon after the beginning of the P wave (atrial depolarization) of the ECG. The transfer of blood from atrium to ventricle achieved by atrial contraction completes the period of ventricular filling. Atrial systole is responsible for the small increases in atrial, ventricular, and venous pressure, as well as ventricular volume (Fig. 16-40). Throughout ventricular diastole, atrial pressure barely exceeds ventricular pressure. This small pressure difference indicates that the pathway through the open AV valves during ventricular filling has low resistance.
|
| Because there are no valves at the junction of the venae cavae and right atrium or the pulmonary veins and left atrium, atrial contraction may force blood in both directions. However, little blood is actually pumped back into the venous tributaries during the brief atrial contraction, mainly because of the inertia of the inflowing blood.
|
| The contribution of atrial contraction to ventricular filling is governed to a great extent by the heart rate and the position of the AV valves. At slow heart rates, filling practically ceases toward the end of diastasis, and atrial contraction contributes little additional filling. During tachycardia, however, diastasis is abbreviated and the atrial contribution can become substantial. Should tachycardia become so great that the rapid filling phase is encroached upon, atrial contraction assumes great importance in rapidly propelling blood into the ventricle during this brief period of the cardiac cycle. If the period of ventricular relaxation is so brief that filling is seriously impaired, even atrial contraction cannot provide adequate ventricular filling. The consequent reduction in cardiac output may result in syncope (fainting).
|
| Pressure-Volume Relationship
|
| Atrial contraction is not essential for ventricular filling, as can be observed in patients with atrial fibrillation or complete heart block. In atrial fibrillation, the atrial myofibers contract in a continuous, uncoordinated fashion and therefore cannot pump blood into the ventricles. In complete heart block, the atria and ventricles beat independently of each other. However, ventricular filling may be normal in patients with these two arrhythmias. |
| In certain disease states, the AV valves may be markedly narrowed (stenotic). Under such conditions, atrial contraction plays a much more important role in ventricular filling than it does in a normal heart. |
| page 325 | | | page 326 |
| Figure 16-44 Pressure-volume loop of the left ventricle for a single cardiac cycle (ABCDEF). |
| The changes in left ventricular pressure and volume throughout the cardiac cycle are summarized in Figure 16-44. Diastolic filling starts at A, when the mitral valve
opens, and it terminates at C, when the mitral valve closes. The initial decrease in left ventricular pressure (A to B), despite the rapid inflow of blood from the left atrium, is attributed to progressive ventricular relaxation and distensibility. During the remainder of diastole (B to C), the increase in ventricular pressure reflects ventricular filling and changes in the passive elastic characteristics of the ventricle. Note that only a small increase in pressure accompanies the substantial increase in ventricular volume during diastole (B to C). The small pressure increase reflects the compliance of the left ventricle during diastole. The small increase in pressure just to the left of C is caused by the contribution of atrial contraction to ventricular filling. With isovolumic contraction (C to D), pressure rises steeply, but ventricular volume does not change because the mitral and aortic valves are both closed. At D, the aortic valve opens, and during the first phase of ejection (rapid ejection, D to E), the large reduction in volume is associated with a steady increase in ventricular pressure. This reduction in volume is followed by reduced ejection (E to F) and a small decrease in ventricular pressure. The aortic valve closes at F, and this event is followed by isovolumic relaxation (F to A), which is characterized by a sharp drop in pressure. Ventricular volume does not change during the interval from F to A because the mitral and aortic valves are both closed. The mitral valve opens at A to complete one cardiac cycle.
|
| Measurement of Cardiac Output
|
| Figure 16-45 Schema illustrating the Fick principle for measuring cardiac output. The change in color from pulmonary artery to pulmonary vein represents the change in color of the blood as venous blood becomes fully oxygenated. |
| In 1870 the German physiologist Adolph Fick contrived the first method for measuring cardiac output in intact animals and people. The basis for this method, called
the Fick principle, is simply an application of the law of conservation of mass. The principle is derived from the fact that the quantity of O2 delivered to the pulmonary capillaries via the pulmonary artery, plus the quantity of O2 that enters the pulmonary capillaries from the alveoli, must equal the quantity of O2 that is carried away by the pulmonary veins.
|
The Fick principle is depicted schematically in Figure 16-45. The rate of O2 delivery to the lungs, q1, equals the O2 concentration in pulmonary arterial blood, [O2]pa, times pulmonary arterial blood flow, Q, which equals cardiac output; that is,

|
| page 326 | | | page 327 |
Let q2 be the net rate of O2 uptake by the pulmonary capillaries from the alveoli. At equilibrium, q2 equals the O2 consumption of the body. The rate at which O2 is carried away by the pulmonary veins, q3, equals the O2 concentration in pulmonary venous blood, [O2]pv, times total pulmonary venous flow, which is virtually equal to pulmonary arterial blood flow, Q; that is,
From conservation of mass,
 Therefore,

Solving for cardiac output,

Equation 16-5 is the statement of the Fick principle.
|
| Determination of cardiac output by this method requires three values: (1) O2 consumption of the body, (2) the O2 concentration in pulmonary venous blood ([O2]pv), and (3) the O2 concentration in pulmonary arterial blood ([O2]pa). O2 consumption is computed from measurements of the volume and O2 content of expired air over a given interval. Because the O2 concentration of peripheral arterial blood is essentially identical to that in the pulmonary veins, [O2]pv is determined on a sample of peripheral arterial blood withdrawn by needle puncture. The compositions of pulmonary arterial blood and mixed systemic venous blood are virtually identical to one another. Samples for O2 analysis are obtained from the pulmonary artery or right ventricle through a catheter. A very flexible catheter with a small balloon near the tip can be inserted into a peripheral vein. As the flexible tube is advanced, the flowing blood carries it toward the heart. By following the pressure changes, the physician can advance the catheter tip into the pulmonary artery.
|
| By using the values depicted in Figure 16-45, cardiac output can be calculated as follows. With an O2 consumption of 250 mL/min, an arterial (pulmonary venous) O2 content of 0.20 mL O2/mL blood, and a mixed venous (pulmonary arterial) O2 content of 0.15 mL O2/mL blood, cardiac output equals 250/(0.20 - 0.15) = 5000 mL/min.
|
| The Fick principle is also used to estimate the O2 consumption of organs when blood flow and the O2 content of arterial and venous blood can be determined. Algebraic rearrangement reveals that O2 consumption equals blood flow times the arteriovenous O2 concentration difference. For example, if blood flow through one kidney is 700 mL/min, the arterial O2 content is 0.20 mL O2/mL blood, and the renal venous O2 content is 0.18 mL O2/mL blood, the rate of O2 consumption by that kidney must be 700 (0.20 - 0.18) = 14 mL O2/min.
|
| Cardiac output can be measured noninvasively with Doppler echocardiography. By this method, the velocity of blood in the ascending aorta is measured, and knowing the cross-sectional area of the aorta (also measured by echocardiography) allows the volume of blood ejected in a single beat (i.e., stroke volume) to be determined. Multiplying stroke volume by the heart rate then yields a value for cardiac output in liters per minute.
|
| Cardiac Oxygen Consumption and Work
|
| Consumption of O2 by the heart depends on the amount and type of activity that the heart performs. Under basal conditions, myocardial O2 consumption is about 8 to 10 mL/min/100 g of heart. It can increase severalfold during exercise and decrease moderately under such conditions as hypotension and hypothermia. The O2 content of cardiac venous blood is normally low (about 5 mL/dL), and the myocardium can receive little additional O2 by further extraction of O2 from coronary blood. Therefore, increased O2 demands of the heart must be met mainly by an increase in coronary blood flow (see Chapter 17). In experiments in which the heartbeat is arrested but coronary perfusion is maintained, O2 consumption falls to 2 mL/min/100 g or less, which is still six to seven times greater than the O2 consumption of resting skeletal muscle.
|
Left ventricular work per beat (stroke work) is approximately equal to the product of stroke volume and the mean aortic pressure against which the blood is ejected by the left ventricle. Cardiac work, W, may be defined as
That is, each small increment in volume that is pumped, dV, is multiplied by the associated pressure P, and the products (PdV) are integrated over the time interval of interest, t2 - t1, to give total work. Under conditions of steady flow,

|
| At resting levels of cardiac output, the kinetic energy component is negligible. However, with high cardiac output, as in strenuous exercise, the kinetic energy component can account for up to 50% of total cardiac work. Simultaneously halving aortic pressure and doubling cardiac output, or vice versa, will result in the same value for cardiac work. However, the O2 requirements are greater for any given amount of cardiac work when a major proportion of the work is pressure work as opposed to volume work. An increase in cardiac output at a constant aortic pressure (volume work) is accomplished with only a small increase in left ventricular O2 consumption, whereas increased arterial pressure at constant cardiac output (pressure work) is accompanied by a large increase in myocardial O2 consumption. Thus, myocardial O2 consumption may not correlate well with overall cardiac work. The magnitude and duration of left ventricular pressure do correlate with left ventricular O2 consumption.
|
| The work of the right ventricle is a seventh that of the left ventricle because pulmonary vascular resistance is much less than systemic vascular resistance.
|
| page 327 | | | page 328 |
| The greater energy demand of pressure work than of volume work is clinically important, especially in aortic stenosis. In this condition, left ventricular O2 consumption is increased, mainly because of the high intraventricular pressure developed during systole. However, coronary perfusion pressure, and hence O2 supply, is either normal or reduced because of the pressure drop across the narrow orifice of the diseased aortic valve. |
The efficiency of the heart may be calculated as the ratio of the work accomplished to the total energy used. If the average O2 consumption is assumed to be 9 mL/min/100 g for the two ventricles, a 300-g heart will consume 27 mL O2/min. This value is equivalent to 130 small calories when the respiratory quotient is 0.82. Together, the two ventricles do about 8 kg-m of
work per minute, which is equivalent to 18.7 small calories. Therefore, the gross efficiency of the heart is about 14%.

|
| The gross mechanical efficiency of the heart is slightly higher (18%) and is determined by subtracting the O2 consumption of the nonbeating (asystolic) heart (about 2 mL/min/100 g) from the total cardiac O2 consumption in the calculation of efficiency. The efficiency of the heart as a pump is relatively low. During physical exercise, efficiency improves because mean blood pressure shows little change whereas cardiac output and work increase considerably, without a proportional increase in myocardial O2 consumption. Interestingly, the chemical efficiency of the heart is rather high as indicated by the estimate of 60% for the efficiency of generating ATP from oxidative phosphorylation. The energy expended in cardiac metabolism that does not contribute to the propulsion of blood through the body appears in the form of heat. The energy of flowing blood is also dissipated as heat.
|
| The heart is versatile in its use of substrates, and within certain limits, uptake of a particular substrate is directly proportional to its arterial concentration. The use of one substrate by the heart is also influenced by the presence or absence of other substrates. For example, the addition of lactate to the blood that perfuses a heart metabolizing glucose leads to a reduction in glucose uptake and vice versa. At normal blood concentrations, glucose and lactate are consumed at about equal rates.
|
| In contrast, uptake of pyruvate is very low, as is its arterial concentration. For glucose, the threshold concentration is about 4 mM. Below this blood level, no glucose is taken up by the myocardium. Insulin reduces the glucose threshold and increases the rate of glucose uptake by the heart. A very low threshold exists for cardiac utilization of lactate; insulin does not affect its uptake by the myocardium. Under hypoxic conditions, glucose utilization is facilitated by an increase in the rate of transport across the myocardial cell wall. However, lactate cannot be metabolized by the hypoxic heart and is produced by the heart under anaerobic conditions. Associated with lactate production by the hypoxic heart is the breakdown of cardiac glycogen.
|
| Of the total cardiac O2 consumption, only 35% to 40% can be accounted for by the oxidation of carbohydrate. Thus, the heart derives the major part of its energy from the oxidation of noncarbohydrate sources, namely, esterified and nonesterified fatty acids, which account for about 60% of the myocardial O2 consumption in subjects in the postabsorptive state. Various fatty acids have different thresholds for myocardial uptake, but these acids are generally used in direct proportion to their arterial concentration. Ketone bodies, especially acetoacetate, are readily oxidized by the heart, and they contribute a major source of energy in diabetic acidosis. As is true of carbohydrate substrates, use of a specific noncarbohydrate is influenced by the presence of other substrates, whether noncarbohydrate or carbohydrate. Therefore, within certain limits, the heart preferentially uses the substrate that is available in the largest concentration. The contribution to myocardial energy expenditure provided by the oxidation of amino acids is small.
|
| Normally, the heart derives its energy by oxidative phosphorylation, in which each mole of glucose yields 36 mol of ATP. However, during hypoxia, glycolysis takes over, and 2 mol of ATP is provided by each mole of glucose; β oxidation of fatty acids is also curtailed. If hypoxia is prolonged, cellular creatine phosphate and eventually ATP are depleted.
|
| In ischemia, lactic acid accumulates and decreases intracellular pH. This condition inhibits glycolysis, fatty acid use, and protein synthesis, and therefore it results in cellular damage and eventually necrosis of myocardial cells.
|
| page 328 | | | page 329 |
- The transmembrane action potentials recorded from cardiac myocytes may contain the following five phases:
- Phase 0: The action potential upstroke is initiated when a suprathreshold stimulus rapidly depolarizes the membrane by activating the fast Na+ channels.
- Phase 1: The notch is an early partial repolarization that is achieved by the efflux of K+ through transmembrane channels that conduct the transient outward current ito.
- Phase 2: The plateau represents a balance between the influx of Ca++ through transmembrane Ca++ channels and the efflux of K+ through several types of K+ channels.
- Phase 3: Final repolarization is initiated when the efflux of K+ exceeds the influx of Ca++. The resultant partial repolarization rapidly increases K+ conductance and restores full repolarization.
- Phase 4: The resting potential of the fully repolarized cell is determined by conductance of the cell membrane to K+, mainly through iK1 channels.
- Fast-response action potentials are recorded from atrial and ventricular myocardial fibers and from
ventricular specialized conducting (Purkinje) fibers. The action potential is characterized by a large amplitude, a steep upstroke, and a relatively long plateau. The effective refractory period of fast-response fibers begins at the upstroke of the action potential and persists until midway through phase 3. The fiber is relatively refractory during the remainder of phase 3, and it regains full excitability soon after it is fully repolarized (phase 4).
- Slow-response action potentials are recorded from normal SA and AV nodal cells and from abnormal myocardial cells that have been partially depolarized. The action potential is characterized by a less negative resting potential, a smaller amplitude, a less steep upstroke, and a shorter plateau than is typical of the fast-response action potential. The upstroke in slow-response fibers is produced by the activation of Ca++ channels. Slow-response fibers become absolutely refractory at the beginning of the upstroke, and partial excitability may not be regained until very late in phase 3 or until after the fiber is fully repolarized.
- Normally, the SA node serves as the cardiac pacemaker to initiate the cardiac impulse. This impulse is propagated from the SA node to the atria and ultimately reaches the AV node. After a delay in the AV node, the cardiac impulse is propagated throughout the ventricles. Ectopic foci in the atrium, AV node, or His-Purkinje system may initiate propagated cardiac impulses if the normal pacemaker cells in the SA node are suppressed or if the rhythmicity of the ectopic automatic cells is abnormally enhanced.
- Under certain abnormal conditions, afterdepolarizations may be triggered by an otherwise normal action potential. EADs arise early in phase 3 of a normal action potential. They are more likely to occur when the basic cycle length of the initiating beats is very long and when the cardiac action potentials are abnormally prolonged. DADs appear late in phase 3 or in phase 4. They are more likely to occur when the basic cycle length of the initiating beats is short and when the cardiac cells are overloaded with Ca++.
- Reentrant arrhythmias occur when a cardiac impulse traverses a loop of cardiac fibers and reenters previously excited tissue, when the impulse is conducted slowly around the loop, and when the impulse is blocked unidirectionally in some section of the loop.
- The ECG, which is recorded from the surface of the body, traces the conduction of the cardiac impulse throughout the heart. The ECG may be used to detect and analyze certain cardiac arrhythmias, such as altered sinoatrial rhythms, AV conduction blocks, premature depolarizations, ectopic tachycardias, and atrial and ventricular fibrillation.
- On excitation, voltage-gated Ca++ channels open to admit extracellular Ca++ into the cell. The influx of Ca++ triggers the release of Ca++ from the sarcoplasmic reticulum. The elevated [Ca++]i elicits contraction of the myofilaments. Relaxation is accomplished via restoration of resting cytosolic [Ca++] by pumping Ca++ back into the sarcoplasmic reticulum and exchanging it for extracellular Na+ across the sarcolemma. Velocity and force of contraction are functions of [Ca++]i. Force and velocity are inversely related, so with no load, velocity is maximal. In an isovolumic contraction, no external shortening occurs.
- In ventricular contraction, preload is stretch of the fibers by blood during ventricular filling. Afterload is the arterial pressure against which the ventricle ejects the blood. An increase in myocardial fiber length, as occurs with augmented ventricular filling (preload) during diastole, produces a more forceful ventricular contraction. This relationship between fiber length and strength of contraction is known as the Frank-Starling relationship or Starling's law of the heart.
- Contractility is an expression of cardiac performance at a given preload and afterload. Contractility can be modulated by the autonomic nervous system.
- Cardiac output can be determined, according to the Fick principle, by measuring the O2 consumption of the body (q2) and the oxygen content of arterial ([O2]a) and mixed venous ([O2]v) blood. Cardiac output = q2/([O2]a - [O2]v). It can also be measured noninvasively by Doppler echocardiography.
- The myocardium functions only aerobically, and in general it uses substrates in proportion to their arterial concentration.
|
|
|