| 22 Ventilation (V), Perfusion (Q), and V/Q Relationships
|
| Ventilation and pulmonary blood flow (perfusion) are important components of gas exchange in the lung. However, the major determinant of normal gas exchange and thus the level of Po2 and Pco2 in blood is the relationship between ventilation and perfusion. This relationship is called the V/Q ratio.
|
Ventilation is the process by which air moves in and out of the lung. As previously described, minute (or total) ventilation (VE) is the volume of air that enters or leaves the lung per minute and it is described by

where f is the frequency or number of breaths per minute and TV, also known as VT, is the tidal volume, or volume of air inspired (or exhaled) per breath. Tidal volume varies with age, gender, body position, and metabolic activity. In an average-sized adult at rest, tidal volume is 500 mL. In children, it is 3 to 5 mL/kg.
|
| Inspiration brings ambient air to the alveoli, where O2 is taken up and CO2 is excreted. Alveolar ventilation thus begins with ambient air. Ambient air is a gas mixture composed of N2 and O2, with minute quantities of CO2, argon, and inert gases. The composition of a gas mixture can be described in terms of either gas fractions or the corresponding partial pressure. Because ambient air is a gas, it obeys the gas laws.
|
When these gas laws are applied to ambient air, two important principles arise. The first is that when the components are viewed in terms of gas fractions (F), the sum of the individual gas fractions must equal one.

|
Three important gas laws govern ambient air and alveolar ventilation: Boyle's law, Dalton's law, and Henry's law. Boyle's law states that when temperature is constant, pressure (P) and volume (V) are inversely related, that is,
 |
| Dalton's law states that the partial pressure of a gas in a gas mixture is the pressure that the gas would exert if it occupied the total volume of the mixture in the absence of the other components. Henry's law states that the concentration of a gas dissolved in a liquid is proportional to its partial pressure. |
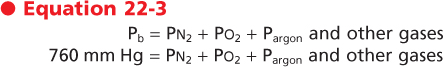
It follows, then, that the sum of the partial pressures (in mm Hg) or the tensions (in torr) of a gas must be equal to the total pressure. Thus, at sea level, where atmospheric pressure is 760 mm Hg, the partial
pressures of the gases in air (also known as barometric pressure (Pb) are
|
The second important principle is that the partial pressure of a gas (Pgas) is equal to the fraction of that gas in the gas mixture (Fgas) times the total or ambient (barometric) pressure.
|
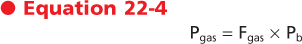
Ambient air is composed of approximately 21% O2 and 79% N2. Therefore, the partial pressure of O2 in ambient air (Po2) is
|
| This is the O2 tension (i.e., the partial pressure of O2) of ambient air at the mouth at the start of inspiration. The O2 tension at the mouth can be altered in one of two ways-by changing the fraction of O2 or by changing barometric (atmospheric) pressure. Thus, ambient O2 tension can be increased through the administration of supplemental O2 and is decreased at high altitude.
|
| page 444 |  | | page 445 |
|
Table 22-1.
Total and Partial Pressures of Respiratory Gases in Ideal Alveolar Gas and Blood at Sea Level (760mmHg) |
| | Ambient Air (Dry) | Moist Tracheal Air | Alveolar Gas (R = 0.8) | Systemic Arterial Blood | Mixed Venous Blood |
| Po2 | 159 | 150 | 102 | 90 | 40 |
| Pco2 | 0 | 0 | 40 | 40 | 46 |
| Ph2o, 37° C | 0 | 47 | 47 | 47 | 47 |
| Pn2 | 601 | 563 | 571* | 571 | 571 |
| PTOTAL | 760 | 760 | 760 | 760 | 704† |
*Pn2 is increased in alveolar gas by 1% because R is less than 1 normally.
†PTOTAL is less in venous than in arterial blood because Po2 has decreased more than Pco2 has increased.
|
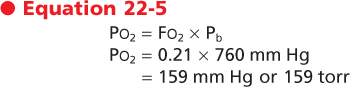
As inspiration begins, the ambient air is brought into the airways, where it becomes warmed to body
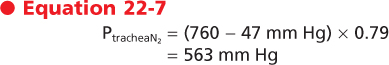
temperature and humidified. Inspired gases become saturated with water vapor, which exerts a partial pressure and dilutes the total pressure of the other gases. Water vapor pressure at body temperature is 47 mm Hg. To calculate the partial pressure of a gas in a humidified mixture, the water vapor partial pressure must be subtracted from the total barometric pressure. Thus, in the conducting airways the partial pressure of O2 is
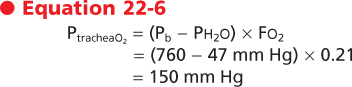
and the partial pressure of N2 is
|
| Note that the total pressure has remained 760 mm Hg (150 + 563 + 47 mm Hg). Water vapor pressure, however, has reduced the partial pressures of O2 and N2. The conducting airways do not participate in gas exchange. Therefore, the partial pressures of O2, N2, and water vapor remain unchanged in the airways until the gas reaches the alveolus.
|
When the inspired gas reaches the alveolus, O2 is transported across the alveolar membrane, and CO2 moves from the capillary bed into the alveolus. The process by which this occurs is described in Chapter 23. At the end of inspiration and with the glottis open, the total pressure in the alveolus is atmospheric; thus, the partial pressures of the gases in the alveolus must equal the total pressure, which in this case is atmospheric. The composition of the gas mixture, however, is changed and can be described as

|
N2 and argon are inert gases, and therefore the fraction of these gases in the alveolus does not change over time. The fraction of water vapor also does not change because the gas is already fully saturated with water vapor and is at body temperature by the time that it reaches the trachea. As a consequence of gas exchange, the fraction of O2 in the alveolus decreases and the fraction of CO2 in the alveolus increases. Because of changes in the fractions of O2 and CO2, the partial pressure exerted by these gases also changes. The partial pressure of O2 in the alveolus (Pao2) is given by the alveolar gas equation, which is also called the ideal alveolar oxygen equation:
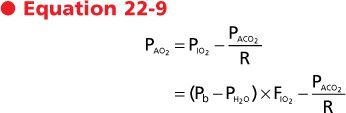
where Pio2 is the inspired partial pressure of O2, which is equal to the fraction (F) of inspired O2 (Fio2) times barometric pressure (Pb) minus water vapor pressure (Ph2o). Paco2 is the CO2 tension of alveolar gas, and R is the respiratory exchange ratio or respiratory quotient. The respiratory quotient is the ratio of CO2 excreted (Vco2) to the O2 taken up (Vo2) by the lungs. This quotient is the amount of CO2 produced relative to the amount of O2 consumed by metabolism and is dependent on caloric intake. The respiratory quotient varies between 0.7 and 1.0 and is 0.7 in states of exclusive fatty acid metabolism and 1.0 in states of exclusive carbohydrate metabolism. Under normal dietary conditions, the respiratory quotient is assumed to be 0.8. Thus, the quantity of O2 taken up exceeds the quantity of CO2 that is released in the alveoli.
|
| The partial pressures of O2, CO2, and N2 from ambient air to the alveolus are shown in Table 22-1.
|
| page 445 | | | page 446 |
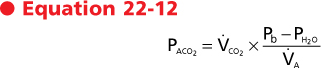
The fraction of CO2 in the alveolus is a function of the rate of CO2 production by the cells during metabolism and the rate at which the CO2 is eliminated from the alveolus. This process of elimination of CO2 is known as alveolar ventilation. The relationship between CO2 production and alveolar ventilation is defined by the alveolar carbon dioxide equation,

where Vco2 is the rate of CO2 production by the body, Va is alveolar ventilation, and Faco2 is the fraction of CO2 in dry alveolar gas. This relationship demonstrates that the rate of elimination of CO2 from the alveolus is related to alveolar ventilation and to the fraction of CO2 in the alveolus. Alveolar Paco2 is defined by the following:

|
Hence, we can substitute in the previous equation and demonstrate the following relationship:
|
| This equation demonstrates several important relationships. First, there is an inverse relationship between the partial pressure of CO2 in the alveolus (Paco2) and alveolar ventilation (Va), irrespective of the exhaled CO2. Specifically, if ventilation is doubled, Paco2 will decrease by 50%. Conversely, if ventilation is decreased by half, the partial pressure of CO2 in the alveolus will double. Second, at a constant alveolar ventilation (Va), doubling of the metabolic production of CO2 (Vco2) will double the partial pressure of CO2 in the alveolus. The relationship between alveolar ventilation and alveolar Pco2 is shown in Figure 22-1.
|
| In normal individuals, arterial Pco2 is tightly regulated and maintained at about 40 mm Hg. Increases or decreases in arterial Pco2, particularly when associated with changes in arterial pH, have profound effects on cell function, including enzyme and transport protein activity. Specialized chemoreceptors monitor Pco2 in arterial blood and in the brainstem (Chapter 24), and minute ventilation varies in accordance with the level of Pco2.
|

|
| Figure 22-1 Alveolar Pco2 as a function of alveolar ventilation in the lung. Each line corresponds to a given metabolic rate associated with a constant production of CO2 (Vco2 isometabolic line). Normally, alveolar ventilation is controlled to maintain an alveolar Pco2 of about 40 torr. Thus, at rest, when Vco2 is approximately 250 mL/min, alveolar ventilation of 5 L/min will result in an alveolar Pco2 of 40 mm Hg. A 50% decrease in ventilation at rest (i.e., from 5 to 2.5 L/min) results in doubling of alveolar Pco2. During exercise, CO2 production is increased (Vco2 = 750 mL/min), and to maintain a normal Pco2, ventilation must increase (in this case to 15 L/min). Again, however, a 50% reduction in ventilation (15 to 7.5 L/min) will result in doubling of Pco2. |
| An increase in arterial Pco2 results in respiratory acidosis (pH <7.35), whereas a decrease in arterial Pco2 results in respiratory alkalosis (pH >7.45). Hypercapnia is defined as an elevation in arterial Pco2, and it is secondary to inadequate alveolar ventilation (hypoventilation) relative to CO2 production. Conversely, hyperventilation occurs when alveolar ventilation exceeds CO2 production, and it decreases arterial Pco2 (hypocapnia).
|
| Distribution of Ventilation
|
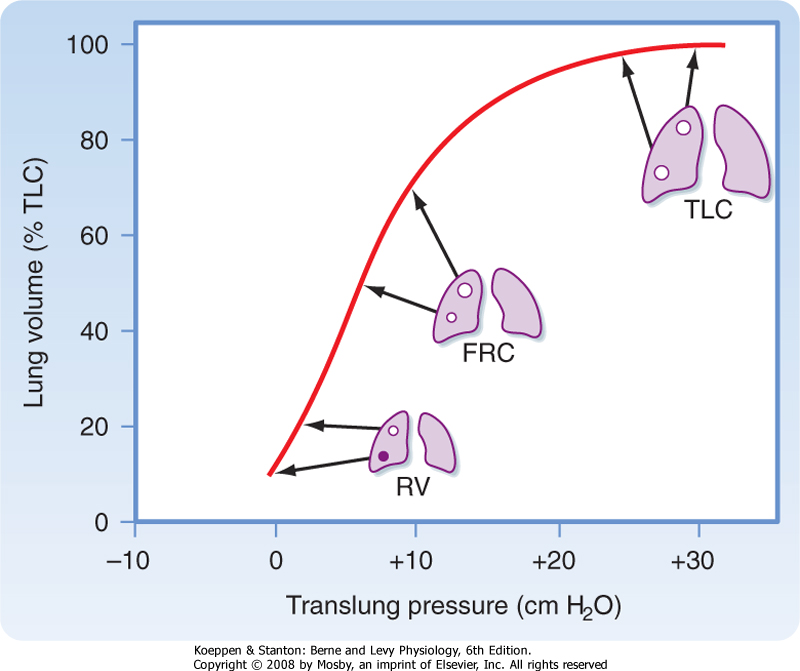
| Figure 22-2 Regional distribution of lung volume, including alveolar size and location on the pressure-volume curve of the lung at different lung volumes. Because of suspension of the lung in the upright position, the pleural pressure (Ppl) and translung pressure (PL) of units at the apex will be greater than those at the base. These lung units will be larger at any lung volume than units at the base. The effect is greatest at residual volume (RV), is less at functional residual capacity (FRC), and disappears at total lung capacity (TLC). Note also that because of their location on the pressure-volume curve, inspired air will be differentially distributed to these lung units; the lung units at the apex are less compliant and will receive a smaller proportion of the inspired air than the lung units at the base, which are more compliant (i.e., reside at a steeper part of the pressure-volume curve). |
| page 446 | | | page 447 |
| Ventilation is not uniformly distributed in the lung, in large part because of the effects of gravity. In the upright position, alveoli near the apex of the lung are more expanded than alveoli at the base. Gravity pulls the lung downward and away from the chest wall. As a result, pleural pressure is less at the apex than at the base of the lung, and static translung pressure (PL = PA - Ppl) is increased; this results in an increase in alveolar volume at the apex. Because of the difference in alveolar volume at the apex and at the base of the lung (Fig. 22-2), alveoli at the lung base are located along the steep portion of the pressure-volume curve, and they receive more of the ventilation (i.e., they have greater compliance). In contrast, the alveoli at the apex are closer to the top of the pressure-volume curve. They have lower compliance and thus receive
proportionately less of the tidal volume. The effect of gravity is less pronounced when one is supine rather than upright, and it is less when one is supine rather than prone. This is because the diaphragm is pushed cephalad when one is supine, and it affects the size of all of the alveoli.
|
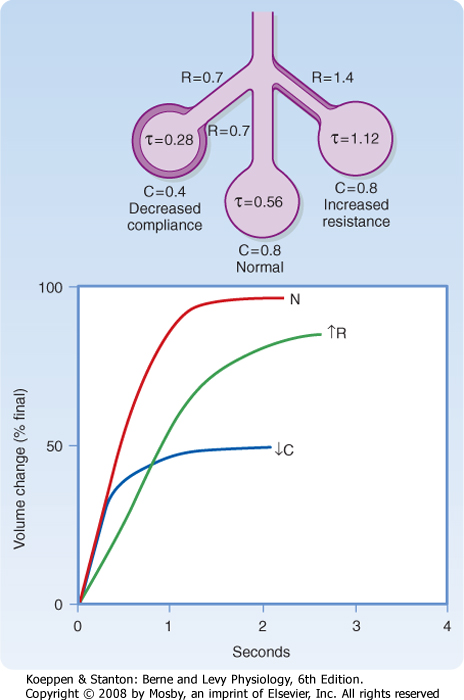
In addition to gravitational effects on the distribution of ventilation, ventilation in the terminal respiratory units is not uniform. This is caused by variable airway resistance (R) or compliance (C), and it may be described quantitatively by the time constant (τ):

|
| Alveolar units with long time constants fill and empty slowly. Thus, an alveolar unit with increased airway resistance or increased compliance will take longer to fill and longer to empty. In normal adults, the respiratory rate is about 12 breaths per minute, the inspiratory time is about 2 seconds, and the expiratory time is about 3 seconds. In normal individuals this time is sufficient to approach equilibrium (Fig. 22-3). In the presence of increased resistance or increased compliance, however, equilibrium is not reached.
|
| Single-Breath Nitrogen Test
|
| The single-breath N2 test can be used to assess the uniformity of ventilation. The subject takes a single maximal inspiration of 100% O2. During the subsequent exhalation, [N2] in the exhaled air is measured. Air (100% O2, 0% N2) initially exits from the conducting airways; then [N2] begins to rise as alveolar emptying occurs. Finally, there is a plateau [N2] as only the alveoli that contain N2 empty (Fig. 22-4).
|
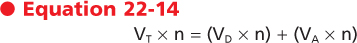
With each breath, air fills the conducting airways and the alveoli. Dead space ventilation is ventilation to airways that do not participate in gas exchange. There are two types of dead space, anatomic dead space and physiological dead space. Anatomic dead space (VD) is composed of the volume of gas that fills the conducting airways. Thus,

where V refers to volume and the subscripts T, D, and A refer to tidal, dead space, and alveolar. A "dot" above V denotes a volume per unit of time (n). Thus,
or

where VE is the exhaled minute volume, VD is the dead space per minute, and VA is alveolar ventilation per minute.
|
|
| Figure 22-3 Examples of local regulation of ventilation as a result of variation in the resistance (R) or compliance (C) of individual lung units. In the upper schema are shown the individual resistance and compliance of three different lung units. In the lower graph are shown the volume of these three lung units as a function of time. In the upper schema, the normal lung has a time constant (τ) of 0.56 second. This unit reaches 97% of final equilibrium in 2 seconds, the normal inspiratory time, as shown in the lower graph. The unit at the right has a twofold increase in resistance; hence its time constant is doubled. That unit fills more slowly and reaches only 80% equilibrium during a normal breath (graph). The unit is underventilated. The unit on the left has reduced compliance (stiff), which acts to reduce its time constant. This unit fills faster than the normal unit but receives only half the ventilation of a normal unit. |
| page 447 | | | page 448 |
| Figure 22-4 The single-breath N2 washout curve is a simple useful pulmonary function test of the regional distribution of ventilation. It clearly shows that not all lung units have equal V/Q. The well-ventilated units (short time constant) empty faster than less well ventilated units (long time constant). The portion of the curve up to the first vertical dashed line represents the washout of dead space air mixed with alveolar gas. The long alveolar plateau rises slowly (<2%) if the distribution of ventilation is relatively uniform, as shown here. The final phase, after the second vertical line, shows very late, slowly emptying alveoli. This phase is accentuated with age. |
If the dead space is 150 mL and tidal volume increases from 500 to 600 mL for the same minute ventilation, what is the effect on dead space ventilation?
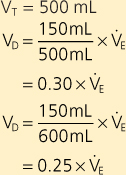 |
| As tidal volume increases, dead space ventilation decreases for the same minute ventilation. |
In a healthy adult, the volume of gas contained in the conducting airways at functional residual capacity (FRC) is approximately 100 to 200 mL, as compared with the 3 L of gas in the entire lung. The ratio of the volume of the conducting airways (dead space) to tidal volume describes the fraction of each breath that is wasted in "filling" the conducting airways. This volume is related to tidal volume (VT) and to minute ventilation (VE) in the following way:
 Dead space ventilation (VD) thus varies inversely with tidal volume (VT). The larger the tidal volume, the smaller the dead space ventilation. Normally, VD/VT is 20% to 30% of minute ventilation.
|
| Physiological Dead Space Ventilation
|
| The second type of dead space is physiological dead space. Alveoli that are perfused but not ventilated are often found in diseased lungs. The total volume of gas in each breath that does not participate in gas exchange is called the physiological dead space ventilation. This volume includes the anatomic dead space and the dead space secondary to the ventilated but not perfused alveoli. The physiological dead space is always at least as large as the anatomic dead space, and in the presence of disease it may be considerably larger.
|
Dead space in the lungs can be determined by measuring Pco2 in alveolar gas and in mixed expired gas. Exhaled gas is collected in a bag over a period of time, and arterial Pco2 (which is the same as alveolar Pco2) and the Pco2 in the collection bag (Peco2) are measured. CO2 in mixed expired gas is diluted relative to that in alveolar gas, and the extent of the dilution is a function of the wasted ventilation. Dead space volume as a function of tidal volume (VD/VT) is described by the following equation:
 |
| This is called the Bohr dead space equation, named after the physiologist Christian Bohr. |
| Dead space ventilation can also be measured by Fowler's method. The patient takes a single breath of 100% O2 and then exhales into a tube that continuously measures the N2 concentration in the exhaled gas. As the patient exhales, the anatomic dead space empties first. This volume contains 100% O2 and 0% N2 because it has not participated in any gas exchange. As the alveoli begin to empty, O2 partial pressure falls and N2 partial pressure begins to rise. Finally, the partial pressure of N2 is almost uniform, and it represents alveolar gas almost entirely. This phase of expired air exhalation is called the alveolar plateau. The volume with initially 0% N2 plus half of the rising N2 volume is equal to the anatomic dead space. |
| Fowler's and Bohr's methods do not measure exactly the same thing. Fowler's method measures the volume of the conducting airways down to the level at which the inspired gas is rapidly diluted with gas already in the lung. Thus, Fowler's method measures anatomic dead space. In contrast, Bohr's method measures the volume of the lung that does not eliminate CO2. Thus, Bohr's method measures physiological dead space. |
| Perfusion is the process by which deoxygenated blood passes through the lung and becomes reoxygenated.
|
| The Pulmonary Circulation
|
| page 448 | | | page 449 |
| The pulmonary circulation begins with the right atrium. Deoxygenated blood from the right atrium enters the right ventricle via the tricuspid valve, and it is then pumped under low pressure (9 to 24 mm Hg) into the pulmonary artery through the pulmonic valve. The pulmonary artery (pulmonary trunk), which is about 3 cm in diameter, branches quickly (5 cm from the right ventricle) into the right and left main pulmonary arteries, which supply blood to the right and left lungs, respectively. The arteries of the pulmonary circulation are the only arteries in the body that carry deoxygenated blood. The deoxygenated blood in the pulmonary arteries passes through a progressively smaller series of branching vessels (vessel
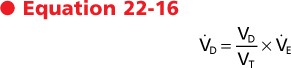
diameters: arteries, >500 μm; arterioles, 10 to 200 μm; capillaries, <10 μm) that end in a complex meshlike network of capillaries (see Chapter 20, Fig. 20-7). The sequential branching pattern of the pulmonary arteries follows the pattern of airway branching. The functions of the pulmonary circulatory system are to (1) reoxygenate the blood and dispense with CO2, (2) aid in fluid balance in the lung, and (3) distribute metabolic products to and from the lung. Oxygenation of red blood cells occurs in the capillaries that surround the alveoli, where the pulmonary capillary bed and the alveoli come together in the alveolar wall in a unique configuration for optimal gas exchange (Fig. 22-5). Gas exchange occurs through this alveolar-capillary network.
|
|
| Figure 22-5 Cross section of an alveolar wall showing the path for diffusion of O2 and CO2. The thin side of the alveolar wall barrier (short double arrow) consists of type I epithelium (I), interstitium (*) formed by the fused basal laminae of the epithelial and endothelial cells, capillary endothelium (E), plasma in the alveolar capillary (C), and finally the cytoplasm of the red blood cell (R). The thick side of the gas exchange barrier (long double arrow) has an accumulation of elastin (EL), collagen (COL), and matrix that jointly separate the alveolar epithelium from the alveolar capillary endothelium. As long as the red blood cells are flowing, O2 and CO2 diffusion probably occurs across both sides of the air-blood barrier. A, alveolus; Nu, nucleus of the capillary endothelial cell. |
| The total blood volume of the pulmonary circulation is about 500 mL, which is about 10% of the circulating blood volume. Approximately 75 mL of blood is present in the alveolar-capillary network of healthy adults at any one time. During exercise, this blood volume increases to 150 to 200 mL because of the recruitment of new capillaries secondary to an increase in pressure and flow. This recruitment of new capillaries is a unique feature of the lung, and it allows for compensation and adjustments to stress, as in the case of exercise. The oxygenated blood leaves the alveolus through a network of small pulmonary venules (15 to 500 μm in diameter) and veins. These small vessels quickly coalesce to form larger pulmonary
veins (>500 μm in diameter) through which the oxygenated blood returns to the left atrium of the heart. In contrast to arteries, arterioles, and capillaries, which closely follow the branching patterns of the airways, venules and veins run quite distant from the airways.
|
| Structural Features of the Pulmonary and Bronchial Circulation
|
| Structure of the Pulmonary Circulation
|
| page 449 | | | page 450 |
| The arteries of the pulmonary circulation are thin walled, with minimal smooth muscle. They are seven times more compliant than systemic vessels, and they are easily distensible. This highly compliant state of the pulmonary arterial vessels requires lower pressure for blood flow through the pulmonary circulation than do the more muscular, noncompliant arterial walls of the systemic circulation. The vessels in the pulmonary circulation, under normal circumstances, are in a dilated state and have larger diameters than do similar arteries in the systemic system. All these factors contribute to a very compliant, low-resistance circulatory system, which aids in the flow of blood through the pulmonary circulation via the relatively weak pumping action of the right ventricle. This low-resistance, low-work system also explains why the right ventricle is less muscular than the left ventricle. The pressure gradient differential for the pulmonary circulation from the pulmonary artery to the left
atrium is only 6 mm Hg (14 mm Hg in the pulmonary artery minus 8 mm Hg in the left atrium) (Fig. 22-6). This pressure gradient differential is almost 15 times less than the pressure gradient differential of 87 mm Hg present in the systemic circulation (90 mm Hg in the aorta minus 3 mm Hg in the right atrium).
|
| Structures of the Extraalveolar and Alveolar Vessels and the Pulmonary Microcirculation
|
| Figure 22-6 Schematic representation of the phasic and mean pressures within the systemic and pulmonary circulations in a normal, resting human adult lying supine. The numbers are millimeters of mercury (mm Hg) for easy comparison. The driving pressure in the systemic circuit is Pao - Pra = 90 - 3 = 87 mm Hg, whereas the driving pressure in the pulmonary circuit is Ppa - Pla = 14 - 8 = 6 mm Hg. Cardiac output must be the same in both circuits in the steady state because they are in series. The resistance to flow through the lungs is less than 10% that of the rest of the body. Note that the pressure in the left heart chambers is higher than that in the right side of the heart. Any congenital openings between the right and left sides of the heart favor left-to-right flow. |
| Though not well defined anatomically, vessels in the pulmonary circulation can be divided into three categories (extraalveolar, alveolar, and microcirculation) based on differences in their physiological properties. The extraalveolar vessels (arteries, arterioles, veins, and venules) are larger than their systemic counterparts. They are not influenced by alveolar pressure changes, but they are affected by intrapleural and interstitial pressure changes. Thus, the caliber of extraalveolar vessels is affected by lung volume and by lung elastin. At high lung volumes, the decrease in pleural pressure increases the caliber of extraalveolar
vessels, whereas at low lung volumes, an increase in pleural pressure decreases vessel caliber. In contrast, alveolar capillaries reside within the interalveolar septa, and they are very sensitive to changes in alveolar pressure but not to changes in pleural or interstitial pressure. Positive pressure ventilation increases alveolar pressure and compresses these capillaries and thus blocks blood flow. This effect is discussed later in this chapter. Finally, the pulmonary microcirculation refers to the small vessels that participate in liquid and solute exchange in maintenance of fluid balance in the lung.
|
| Structure of the Alveolar-Capillary Network
|
| The sequential branching of the pulmonary arteries culminates in a dense meshlike network of capillaries that surround alveoli. This alveolar-capillary network is composed of thin epithelial cells of the alveolus and endothelial cells of the vessels and their supportive matrix and has an alveolar surface area of about 70 m2 (about the size of a tennis court). The structural matrix and the tissue components of this alveolar-capillary network provide the only barrier between gas in the airway and blood in the capillary. The cells of this barrier, which is 1 to 2 μm thick, include type I alveolar epithelial cells, capillary endothelial cells, and their respective basement membranes, which are back to back. Surrounded mostly by air, this alveolar-capillary network creates an ideal environment for gas exchange. Red blood cells pass through the capillary component of this network in single file in less than 1 second, which is sufficient time for CO2 and O2 gas exchange.
|
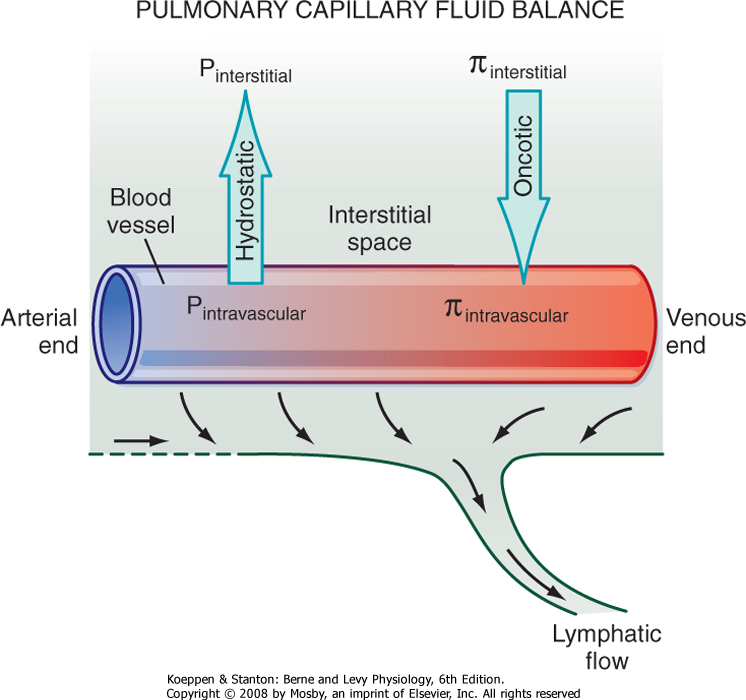
| In addition to gas exchange, the alveolar-capillary network regulates the amount of fluid within the lung. At the pulmonary capillary level, the balance between hydrostatic and oncotic pressure across the wall of the capillary results in a small net movement of fluid out of the vessels into the interstitial space. The fluid is then removed from the lung interstitium by the lymphatic system and enters the circulation via the vena cava in the area of the lung hilus. In normal adults, an average of 30 mL of fluid per hour is returned to the circulation via this route.
|
Starling's equation is used to calculate fluid movement across capillaries:

where
- Kfc = capillary filtration coefficient of the total number of perfused capillaries
- PIV = intravascular hydrostatic pressure
- Pis = interstitial hydrostatic pressure
- σd = reflection coefficient (reflects the permeability of the membrane to protein)
- πIV = intravascular colloid osmotic pressure
- πis = interstitial colloid osmotic pressure
|
| page 450 | | | page 451 |
| Starling's equation illustrates the forces that create the net flux of fluid out of the pulmonary capillaries (Fig. 22-7). Type I and II alveolar epithelial cells establish a tight barrier that restricts fluid from entering the air space. This barrier is very important because any fluid in the air space will interfere with gas diffusion. The alveolar-capillary network is also very fragile and susceptible to various injurious agents. Type I cells are very disposed to injury, perhaps because of their thin, elongated shape and large surface area. In interstitial lung diseases, type I cells die, thereby leaving a denuded alveolar epithelium with increased permeability that allows increased fluid movement into the air spaces and thus results in impaired gas exchange. Injury to type I cells also results in proliferation of the cuboidal-shaped type II epithelial cells and differentiation into type I cells, which restores the normal lung architecture and permeability.
|
| The Bronchial Circulation
|
| Figure 22-7 Factors influencing lung fluid balance. Starling's equation summarizes the balance of forces favoring fluid flux into or out of the pulmonary vessels. Normally there is a net flux of fluid out of the vessels into the interstitium, which is drained from the interstitial space by the lymphatic system. |
| The bronchial circulation is a separate circulatory system in the lung that provides systemic arterial blood to the trachea, upper airways, surface secretory cells, glands, nerves, visceral pleural surface, lymph nodes, pulmonary arteries, and pulmonary veins. The bronchial circulation perfuses the upper respiratory tract; it does not reach the terminal or respiratory bronchioles or the alveolus. Venous blood from the capillaries of the bronchial circulation flows to the heart through either true bronchial veins or bronchopulmonary veins. True bronchial veins are present in the region of the lung hilus, and blood flows into the azygos, hemiazygos, or intercostal veins before entering the right atrium. The bronchopulmonary veins are
formed through a network of tributaries from the bronchial and pulmonary circulatory vessels that anastomose and form vessels with an admixture of blood from both circulatory systems. Blood from these anastomosed vessels returns to the left atrium through pulmonary veins. About two thirds of the total bronchial circulation is returned to the heart via the pulmonary veins and this anastomosis route. The bronchial circulation receives only about 1% of total cardiac output as compared with almost 100% for the pulmonary circulation.
|
| PULMONARY VASCULAR RESISTANCE
|
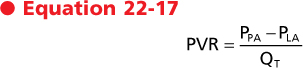
Blood flow in the pulmonary circulations is pulsatile and influenced by pulmonary vascular resistance (PVR), gravity, alveolar pressure, and the arterial-to-venous pressure gradient. PVR is the change in pressure from the pulmonary artery (PPA) to the left atrium (PLA) divided by the flow (QT), which is cardiac output.
|
Under normal circumstances,

|
| This resistance is about 10 times less than that in the systemic circulation. The pulmonary circulation has two unique features, noted previously, that allow increased blood flow on demand without an increase in pressure. First, with increased demand, such as during exertion or exercise, pulmonary vessels that are normally closed are recruited. Second, the blood vessels in the pulmonary circulation are highly distensible and increase their diameter with only a minimal increase in pulmonary arterial pressure.
|
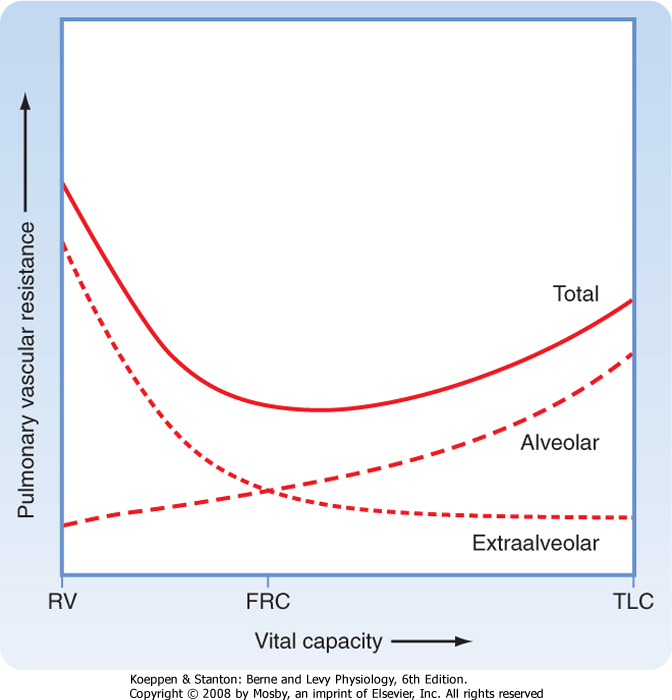
| Lung volume affects PVR through its influence on alveolar capillaries (Fig. 22-8). At end inspiration, the air-filled alveoli compress the alveolar capillaries and increase PVR. In contrast to the capillary beds in the systemic circulation, the capillary bed in the lung accounts for about 40% of PVR. The larger extraalveolar vessels increase in diameter at end inspiration because of radial traction and elastic recoil, and their PVR is lower at higher lung volume. During exhalation, the deflated alveoli apply the least resistance to the alveolar capillaries and their PVR is diminished, whereas the higher pleural pressure during exhalation increases the PVR of extraalveolar vessels. As a result of these opposite effects of lung volume on PVR, total PVR in the lung is lowest at FRC.
|
| DISTRIBUTION OF PULMONARY BLOOD FLOW
|
| page 451 | | | page 452 |
| Figure 22-8 Schematic representation of the effects of changes in vital capacity on total pulmonary vascular resistance and the contributions to the total afforded by alveolar and extraalveolar vessels. During inflation from residual volume (RV) to total lung capacity (TLC), resistance to blood flow through alveolar vessels increases, whereas resistance through extraalveolar vessels decreases. Thus, changes in total pulmonary vascular resistance form a U-shaped curve during lung inflation, with the nadir at FRC. |
| Because the pulmonary circulation is a low-pressure/low-resistance system, it is influenced by gravity much
more dramatically than the systemic circulation is. This gravitational effect contributes to an uneven distribution of blood flow in the lung. In normal upright subjects at rest, blood flow increases from the apex of the lung to the base of the lung, where it is greatest. Similarly, in a supine individual, blood flow is less in the uppermost (anterior) regions and greater in the lower (posterior) regions. Under conditions of stress, such as exercise, the difference in blood flow in the apex and base of the lung in upright subjects becomes less, mainly because of the increase in arterial pressure.
|
| On leaving the pulmonary artery, blood must travel against gravity to the apex of the lung in upright subjects. For every 1-cm increase in height above the heart, there is a corresponding decrease in hydrostatic pressure equal to 0.74 mm Hg. Thus, the pressure in a pulmonary artery segment that is 10 cm above the heart will be 7.4 mm Hg less than the pressure in a segment at the level of the heart. Conversely, a pulmonary artery segment 5 cm below the heart will have a 3.7-mm Hg increase in pulmonary arterial pressure. This effect of gravity on blood flow affects arteries and veins equally and results in wide variations in arterial and venous pressure from the apex to the base of the lung. These variations will influence both flow and ventilation-perfusion relationships.
|
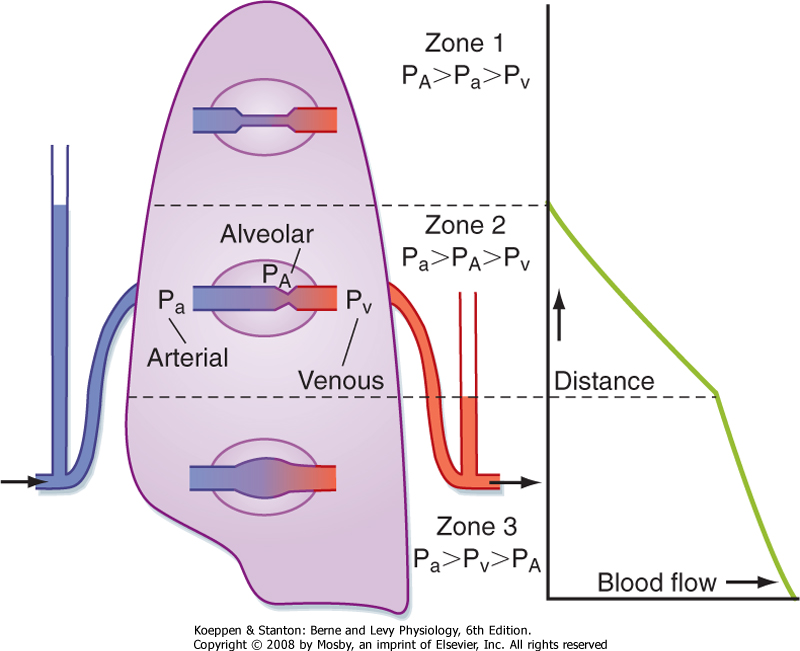
| Figure 22-9 Model to explain the uneven distribution of blood flow in the lung based on the pressures affecting the capillaries. (From West JB et al: J Appl Physiol 19:713, 1964.) |
| In addition to the pulmonary arterial pressure (Pa) to pulmonary venous pressure (Pv) gradients, differences in pulmonary alveolar pressure (PA) also influence blood flow in the lung. Classically, the lung has been divided into three functional zones (Fig. 22-9). Zone 1 represents the lung apex, where Pa is so low that it can be exceeded by PA. The capillaries collapse because of the greater external PA, and blood flow ceases. Under normal conditions this zone does not exist; however, this state could be reached during positive pressure mechanical ventilation or if Pa decreased sufficiently (such as might occur with a marked decrease in blood volume). In zone 2, or the upper third of the lung, Pa is greater than PA, which is also greater than Pv. Because PA is greater than Pv, the greater external PA partially collapses the capillaries and causes a "damming" effect. This phenomenon is often referred to as the "waterfall" effect. In zone 3, Pa is greater than Pv, which is greater than PA, and blood flows in this area in accordance with the pressure gradients. Thus, pulmonary blood flow is greater in the base of the lung because the increased transmural pressure distends the vessels and lowers the resistance.
|
| ACTIVE REGULATION OF BLOOD FLOW
|
| page 452 | | | page 453 |
| Blood flow in the lung is regulated primarily by the passive mechanisms described previously. There are, however, several active mechanisms that regulate blood flow. Although the smooth muscle around pulmonary vessels is much thinner than that around systemic vessels, it is sufficient to affect vessel caliber and thus PVR. O2 levels have a major impact on blood flow. Hypoxic vasoconstriction occurs in small arterial vessels in response to decreased alveolar Po2. The response is local, and it may be a protective response
by shifting blood flow from hypoxic areas to well-perfused areas in an effort to enhance gas exchange. Isolated, local hypoxia does not alter PVR; approximately 20% of the vessels need to be hypoxic before a change in PVR can be measured. Low inspired O2 levels as a result of exposure to high altitude will have a greater effect on PVR because all vessels are affected. High levels of inspired O2 can dilate pulmonary vessels and decrease PVR. Other factors and some hormones (Table 22-2) can influence vessel caliber, but their effects are usually local, short-lived, and important only in pathological conditions.
|
| VENTILATION-PERFUSION RELATIONSHIPS
|
|
Table 22-2.
Factors and Hormones That Regulate Pulmonary Blood Flow |
| Pulmonary Vasoconstrictors |
| Low Pao2 |
| Thromboxane A2 |
| α-Adrenergic catecholamines |
| Angiotensin |
| Leukotrienes |
| Neuropeptides |
| Serotonin |
| Endothelin |
| Histamine |
| Prostaglandins |
| High CO2 |
| Pulmonary Vasodilators |
| High Pao2 |
| Prostacyclin |
| Nitric oxide |
| Acetylcholine |
| Bradykinin |
| Dopamine |
| β-Adrenergic catecholamines |
| Both ventilation (V) and lung perfusion (Q) are essential elements in normal lung function, but they are insufficient to ensure normal gas exchange. The ventilation-perfusion ratio (also referred to as the V/Q ratio) is defined as the ratio of ventilation to blood flow. This ratio can be defined for a single alveolus, for a group of alveoli, or for the entire lung. At the level of a single alveolus, the ratio is defined as alveolar ventilation (VA) divided by capillary flow. At the level of the lung, the ratio is defined as total alveolar ventilation divided by cardiac output. In normal individuals, alveolar ventilation is about 4.0 L/min, whereas pulmonary blood flow is about 5.0 L/min. Thus, in a normal lung the overall ventilation-perfusion ratio is about 0.8, but the range of V/Q ratios varies widely in different lung units. When ventilation exceeds perfusion, the ventilation-perfusion ratio is greater than one (V/Q >1), and
when perfusion exceeds ventilation, the ventilation-perfusion ratio is less than 1 (V/Q <1). Mismatching of pulmonary blood flow and ventilation results in impaired O2 and CO2 transfer. In individuals with cardiopulmonary disease, mismatching of pulmonary blood flow and alveolar ventilation is the most frequent cause of systemic arterial hypoxemia (reduced blood Po2).
|
| A normal ventilation-perfusion ratio does not mean that ventilation and perfusion to that lung unit are normal; it simply means that the relationship between ventilation and perfusion is normal. For example, in lobar pneumonia, ventilation to the affected lobe is decreased. If perfusion to this area remains unchanged, perfusion would exceed ventilation; that is, the ventilation-perfusion ratio would be less than 1 (V/Q <1). However, the decreased ventilation to this area produces hypoxic vasoconstriction in the pulmonary capillary bed supplying this lobe. This results in a decrease in perfusion to the affected area and a more "normal" ventilation-perfusion ratio. Nonetheless, neither the ventilation nor the perfusion to this area is normal (both are decreased), but the relationship between the two approaches the normal range.
|
| Regional Differences in Ventilation-Perfusion Ratios
|
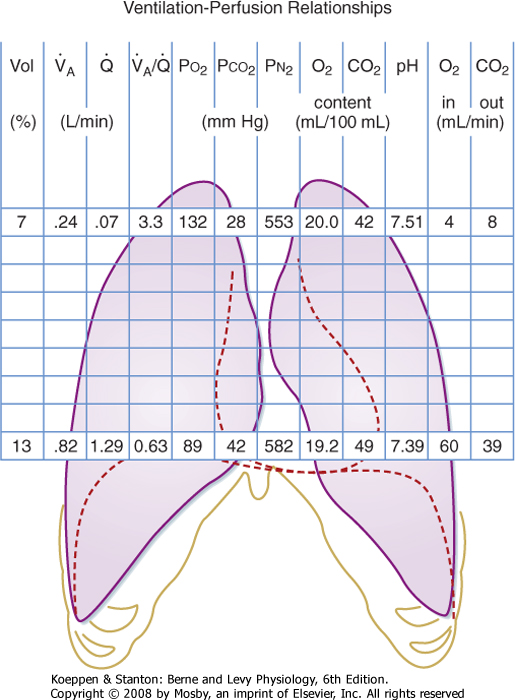
| The ventilation-perfusion ratio varies in different areas of the lung. In an upright subject, ventilation increases more slowly than blood flow from the apex of the lung to the base. Hence, the V/Q ratio at the apex of the lung is much greater than 1, whereas the V/Q ratio at the base of the lung is much less than 1. The relationship between ventilation and perfusion from the apex to the base of the lung is shown in Figure 22-10.
|
| Alveolar-Arterial Po2 Difference
|
| Alveolar CO2 and arterial CO2 are equal. The same is not true for alveolar and arterial O2. Even in normal individuals, alveolar O2 is slightly greater than arterial O2. The difference between alveolar O2 (Pao2) and arterial Po2 (Pao2) is called the alveolar-arterial Po2 difference (AaDo2). An increased in AaDo2 is a hallmark of abnormal O2 exchange. This small difference is not caused by "imperfect" gas exchange, but by the small number of veins that bypass the lung and empty directly into the arterial circulation. The thebesian vessels of the left ventricular myocardium drain directly into the left ventricle (rather than into the coronary sinus in the right atrium), and some bronchial and mediastinal veins drain into the pulmonary veins. This results in venous admixture and a decrease in arterial Po2. (This is an example of an anatomic shunt; see later.) Approximately 2% to 3% of cardiac output is shunted in this way.
|
| page 453 | | | page 454 |
| Figure 22-10 Regional differences in gas exchange in a normal lung. Only the apical and basal values are shown for clarity. |
An individual with pneumonia is receiving 30% supplemental O2 by facemask. Arterial blood gas pH is 7.40, Paco2 is 44 mm Hg, and Pao2 is 70 mm Hg. What is the patient's AaDo2? (Assume that the patient is at sea level and the patient's respiratory quotient is 0.8.) Using the alveolar air equation,
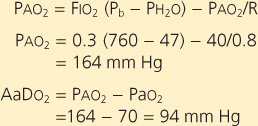 |
| This elevated AaDo2 suggests that this patient has lung disease (in this case, pneumonia). |
| Clinically, the effectiveness of gas exchange is determined by measuring O2 and CO2 in arterial blood. Alveolar Po2 is calculated from the alveolar air equation. The difference, then, between the calculated alveolar Po2 and the measured arterial Po2 is AaDo2. In normal individuals breathing room air, AaDo2 is less than 15 mm Hg. The mean value rises approximately
3 mm Hg per decade of life. Hence, an AaDo2 less than 25 mm Hg is considered to be the upper limit of normal.
|
|
Table 22-3.
Causes of Hypoxemia |
| Cause | Arterial Po2 | AaDo2 | Arterial Po2 Response to 100% O2 |
| Anatomic shunt | Decreased | Increased | No significant change |
| Decreased Fio2 | Decreased | Normal | Increased |
| Physiological shunt | Decreased | Increased | Decreased |
| Low ventilation-perfusion ratio | Decreased | Increased | Increased |
| Diffusion abnormality | Decreased | Increased | Increased |
| Hypoventilation | Decreased | Normal | Increased |
| Abnormalities in arterial Po2 can occur in the presence or absence of an abnormal AaDo2. Hence, the relationship between Pao2 and AaDo2 is useful in determining the cause of an abnormal Pao2 and in predicting the response to therapy (particularly to
supplemental O2 administration). Causes of a reduction in arterial Po2 (arterial hypoxemia) and their effect on AaDo2 are shown in Table 22-3. Each of these causes is discussed in greater detail later.
|
| ARTERIAL BLOOD GAS ABNORMALITIES
|
| Arterial hypoxemia is defined as an arterial Po2 less than 80 mm Hg in an adult who is breathing room air at sea level. Hypoxia occurs when there is insufficient O2 to carry out normal metabolic functions; hypoxia often occurs when arterial Po2 is less than 60 mm Hg. Hypercapnia is defined as an increase in arterial Pco2 above the normal range (40 ± 2 mm Hg), and hypocapnia is an abnormally low arterial Pco2 (usually less than 35 mm Hg).
|
| VENTILATION-PERFUSION IN A SINGLE ALVEOLUS
|
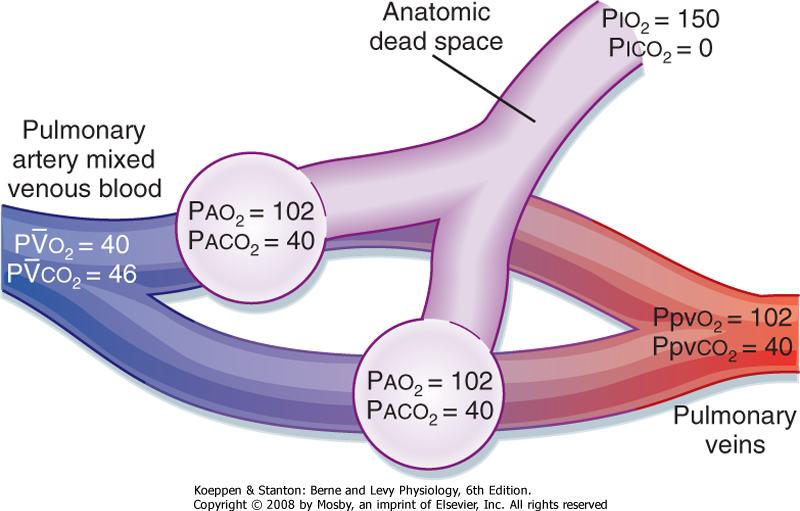
| A useful way to examine the relationship between ventilation and perfusion is the two-lung unit model (Fig. 22-11). Two alveoli are ventilated, each of which is supplied by blood from the heart. When ventilation is uniform, half the inspired gas goes to each alveolus, and when perfusion is uniform, half the cardiac output goes to each alveolus. In this normal unit, the ventilation-perfusion ratio in each of the alveoli is the same and is equal to 1. The alveoli are perfused by mixed venous blood that is deoxygenated and contains increased arterial Pco2. Alveolar O2 is higher than mixed venous O2, and this provides a gradient for movement of O2 into blood. In contrast, mixed venous CO2 is greater than alveolar CO2, and this provides a gradient for movement of CO2 into the alveolus. Note that in this ideal model, alveolar-arterial O2 values do not differ.
|
| page 454 | | | page 455 |
| Figure 22-11 Simplified lung model showing two normal parallel lung units. Both units receive equal quantities of fresh air and blood flow for their size. The blood and alveolar gas partial pressures, P, are normal values in a resting person. |
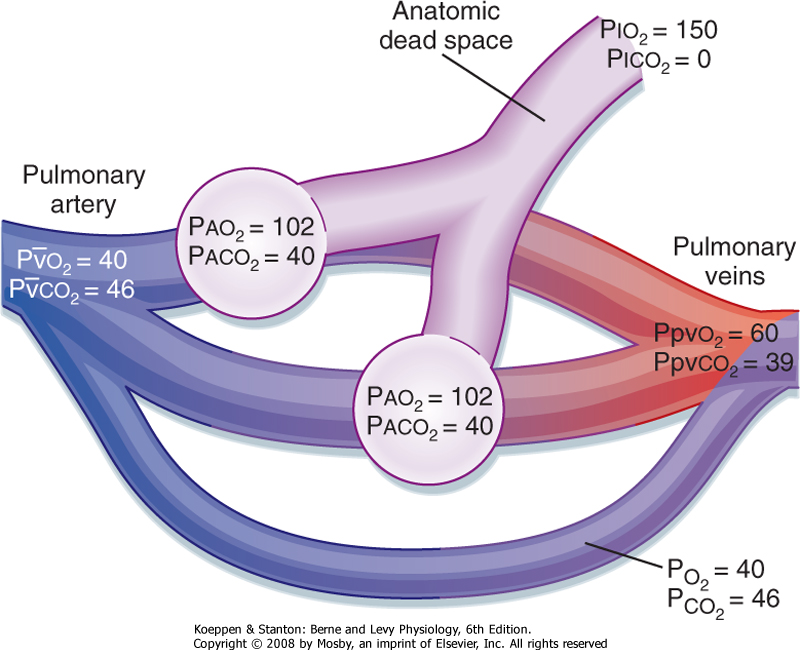
| Figure 22-12 Right-to-left shunt. Alveolar ventilation is normal, but a portion of the cardiac output bypasses the lung and mixes with oxygenated blood. Pao2 will vary depending on the size of the shunt. |
| An anatomic shunt occurs when mixed venous blood bypasses the gas exchange unit and goes directly into arterial blood (Fig. 22-12). Alveolar ventilation, the distribution of alveolar gas, and the composition of alveolar gas are normal, but the distribution of cardiac output is changed. Some of the cardiac output goes through the pulmonary capillary bed that
supplies the gas exchange units, whereas the rest of it bypasses the gas exchange units and goes directly into arterial blood. The blood that bypasses the gas exchange unit is "shunted," and because the blood is deoxygenated, the model is called a right-to-left shunt. Most anatomic shunts occur within the heart, and they occur when deoxygenated blood from the right atrium or ventricle crosses the septum and mixes with blood from the left atrium or ventricle. The effect of this right-to-left shunt is to mix deoxygenated blood with oxygenated blood, and it results in varying degrees of arterial hypoxemia.
|

|
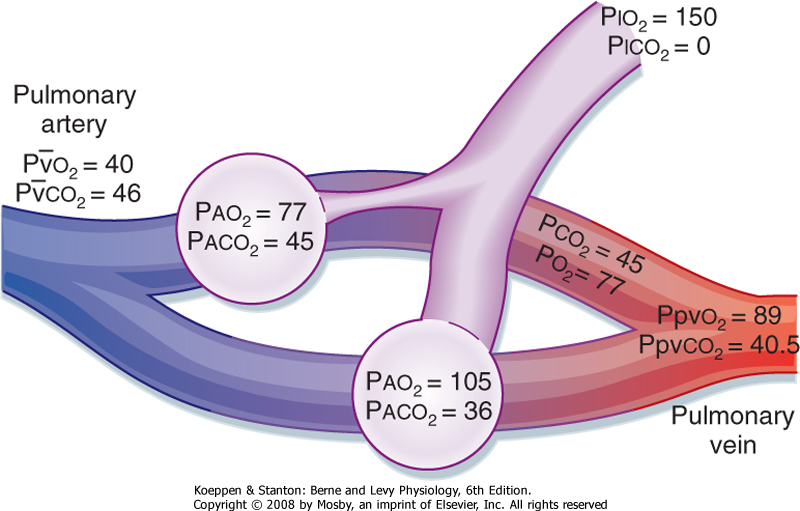
| Figure 22-13 Schema of a physiological shunt (venous admixture). Notice the marked decrease in arterial Po2 in comparison to Pco2. The AaDo2 is 85 mm Hg. |
| An important feature of an anatomic shunt is that the response to giving the individual 100% O2 to breathe is blunted. The blood that bypasses the gas-exchanging units is never exposed to the enriched O2, and thus it continues to be deoxygenated. The Po2 in the blood that is not being shunted increases and mixes with the
deoxygenated blood. Thus, the degree of persistent hypoxemia in response to 100% O2 varies with the extent of the shunted blood. Normally, the hemoglobin in the blood that perfuses the ventilated alveoli is almost fully saturated. Therefore, most of the added O2 is in the form of dissolved O2 (see Chapter 24).
|
| The arterial Pco2 in an anatomic shunt is not usually increased even though the shunted blood has an elevated level of CO2. The reason for this is that the central chemoreceptors respond to any elevation in CO2 with an increase in ventilation and reduce arterial Pco2 to the normal range. If the hypoxemia is severe, the increased respiratory drive secondary to the hypoxemia increases the ventilation and can decrease arterial Pco2 to below the normal range.
|
| A physiological shunt (also known as venous admixture) can develop when ventilation to lung units is absent in the presence of continuing perfusion (Fig. 22-13). In the two-lung unit model, all of the ventilation now goes to the other lung unit, whereas perfusion is equally distributed between both lung units. The lung unit without ventilation but with perfusion has a V/Q ratio of 0. The blood perfusing this unit is mixed venous blood; because there is no ventilation, no gas is exchanged in the unit, and the blood leaving this unit continues to be mixed venous blood. The effect of a physiological shunt on oxygenation is similar to the effect of an anatomic shunt; that is, deoxygenated blood bypasses a gas-exchanging unit and admixes with arterial blood. Clinically, atelectasis (which is obstruction to ventilation of a gas-exchanging unit with subsequent loss of volume) is an example of a lung region with a V/Q of 0. Causes of atelectasis include mucous plugs, airway edema, foreign bodies, and tumors in the airway.
|
| VENTILATION-PERFUSION MISMATCHING: LOW V/Q
|
| page 455 | | | page 456 |
| Mismatching between ventilation and perfusion is the most frequent cause of arterial hypoxemia in patients
with respiratory disorders. In the most common example, the composition of mixed venous blood, total blood flow (cardiac output), and the distribution of blood flow are normal. However, when alveolar ventilation is distributed unevenly between the two gas exchange units (Fig. 22-14) and blood flow is equally distributed, the unit with decreased ventilation has a V/Q ratio of less than 1, whereas the unit with the increased ventilation has a V/Q of greater than 1. This causes the alveolar and end-capillary gas compositions to vary. Both the arterial O2 and CO2 content will be abnormal in the blood that has come from the unit with the decreased ventilation (V/Q <<<1). The unit with the increased ventilation (V/Q >1) will have a lower CO2 and a higher O2 content because it is being overventilated. The actual arterial Po2 and Pco2 will vary, depending on the relative contribution of each of these units to arterial blood. The alveolar-arterial O2 gradient (AaDo2) will be increased because the relative overventilation of one unit does not fully compensate (either by adding extra O2 or by removing extra CO2) for underventilation of the other unit. The failure to compensate is greater for O2 than for CO2 because of the flatness of the upper part of the oxyhemoglobin dissociation curve as opposed to the slope of the CO2 dissociation curve (see Chapter 23). In other words, increased ventilation will increase alveolar Po2, but it adds little extra O2 content to the blood because hemoglobin is close to being 100% saturated in the overventilated areas. This is not the case for CO2, where the steeper slope of the CO2 curve results in removal of more CO2 when ventilation increases. Thus, because CO2 moves by diffusion, as long as a CO2 gradient is maintained, CO2 diffusion will occur.
|
| Figure 22-14 Effects of ventilation-perfusion mismatching on gas exchange. The decrease in ventilation to the one lung unit could be due to mucus obstruction, airway edema, bronchospasm, a foreign body, or a tumor. |
| Alveolar O2 is determined by a balance between the rate of O2 uptake and the rate of O2 replenishment by ventilation. O2 uptake depends on blood flow through
the lung and the metabolic demands of the tissues. If ventilation decreases, alveolar Po2 will decrease and arterial Po2 will subsequently decrease. In addition, alveolar ventilation and alveolar CO2 are directly related. When ventilation is halved, the alveolar CO2 content and thus the arterial CO2 content doubles (see Equation 22-8). Ventilation insufficient to maintain normal levels of CO2 is called hypoventilation. Hypoventilation always decreases Pao2 and increases Paco2.
|
| One of the hallmarks of hypoventilation is a normal AaDo2. Hypoventilation reduces alveolar O2, which in turn results in a decrease in arterial O2. Because gas exchange is normal, the difference between alveolar and arterial O2 remains normal. Hypoventilation is seen in individuals with diseases associated with muscle weakness and in association with drugs that reduce the respiratory drive. In the presence of hypoventilation, however, areas of atelectasis develop rapidly; atelectasis creates regions with V/Q ratios of 0, and the AaDo2 then rises.
|
| Abnormalities in diffusion of O2 across the alveolar-capillary barrier could potentially result in arterial hypoxia. Equilibration between alveolar and capillary O2 and CO2 content occurs rapidly and in a fraction of the time that it takes for red blood cells to transit the pulmonary capillary network. Hence, diffusion equilibrium almost always occurs in normal subjects, even during exercise, when the transit time of red blood cells through the lung increases significantly. An alveolar-arterial Po2 difference attributable to incomplete diffusion (diffusion disequilibrium) has been observed in normal individuals only during exercise at high altitude (≥10,000 feet). Even in individuals with abnormal diffusion capacity, diffusion disequilibrium at rest is unusual but is possible during exercise and at altitude. Alveolar capillary block, or thickening of the air-blood barrier, is an uncommon cause of hypoxemia. Even with a thickened alveolar wall there is sufficient time for gas diffusion unless the red blood cell transit time is increased.
|
| MECHANISMS OF HYPERCAPNIA
|
| page 456 | | | page 457 |
| Two major mechanisms account for the development of hypercapnia (elevated Pco2): hypoventilation and wasted ventilation. As noted previously, alveolar ventilation and alveolar CO2 are inversely related. When ventilation is halved, alveolar CO2 and arterial CO2 double. Hypoventilation always decreases Pao2 and increases Paco2 and thereby results in a hypoxemia that responds to an enriched source of O2. Wasted or dead space ventilation occurs when pulmonary blood flow is interrupted in the presence of normal ventilation. This occurs most often because of a pulmonary embolus that obstructs blood flow. The embolus halts blood flow to pulmonary areas with normal ventilation
(V/Q = ∞). In this situation the ventilation is wasted because it fails to oxygenate any of the mixed venous blood. The ventilation to the perfused regions of the lung is less than ideal (i.e., there is relative "hypoventilation" to this area because it now receives all the pulmonary blood flow with "normal" ventilation). If compensation does not occur, Paco2 would increase and Pao2 would decrease. Compensation after a pulmonary embolus, however, begins almost immediately; local bronchoconstriction occurs and the distribution of ventilation shifts to the areas being perfused. As a result, changes in arterial CO2 and O2 content are minimized.
|
| EFFECT OF 100% OXYGEN ON ARTERIAL BLOOD GAS ABNORMALITIES
|
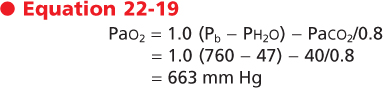
One of the ways that a right-to-left shunt can be distinguished from other causes of hypoxemia is by having the individual breathe 100% O2 through a nonrebreathing facemask for approximately 15 minutes. When the subject breathes 100% O2, all of the N2 in the alveolus is replaced by O2. Thus, alveolar O2, from the alveolar air equation, is
|
| In a normal lung the alveolar O2 content rapidly increases, and it provides the gradient for transfer of O2 into capillary blood. This is associated with a marked increase in arterial O2 content (Table 22-3). Similarly, over the 15-minute period of breathing enriched O2, even areas with very low V/Q ratios will develop high alveolar O2 pressure as the N2 is replaced by O2. In the presence of normal perfusion to these areas, there is a gradient for gas exchange, and the end-capillary blood is highly enriched in O2. In contrast, in the presence of a right-to-left shunt, oxygenation is not corrected because mixed venous blood continues to flow through the shunt and mix with blood that has perfused normal units. The poorly oxygenated blood from the shunt lowers the arterial O2 content and maintains the AaDo2. An elevated alveolar-arterial O2 difference during a properly conducted study with 100% O2 signifies the presence of a right-to-left shunt; the magnitude of the difference can be used to quantify the proportion of the cardiac output that is being shunted.
|
| EFFECT OF CHANGING CARDIAC OUTPUT
|
| Change in cardiac output is the only nonrespiratory factor that affects gas exchange. Decreasing cardiac output diminishes the O2 content and increases the CO2 content of mixed venous blood. Increasing the cardiac output has the opposite effect. This change in O2 and CO2 content will have little effect on arterial O2 and CO2 levels in individuals with normal lungs, unless cardiac output is extremely low. In the presence of lung disease secondary to ventilation-perfusion mismatching or in the presence of an anatomic shunt, the composition of mixed venous blood will have a significant effect on the arterial levels of O2 and CO2. For any level of V/Q abnormality, a decrease in cardiac output is associated with an increasingly abnormal Pao2.
|
| We have already discussed regional differences in ventilation and perfusion and the relationship between ventilation and perfusion. We have also discussed the effects of various physiological abnormalities (e.g., shunt, V/Q mismatch, and hypoventilation) on arterial O2 and CO2 levels. Before leaving this topic, however, it should be noted that because the V/Q ratio varies in different regions of the lung, the end-capillary blood coming from these regions will have different O2 and CO2 levels. These differences are shown in Figure 22-10, and they demonstrate the complexity of the lung. First, recall that the volume of the lung at the apex is less than the volume at the base. As previously described, ventilation and perfusion are less at the apex than at the base, but the differences in perfusion are greater than the differences in ventilation. Thus, the V/Q ratio is high at the apex and low at the base. This difference in ventilation-perfusion ratios is associated with a difference in alveolar O2 and CO2 content between the apex and the base. The alveolar O2 content is higher and the alveolar CO2 content is lower in the apex than in the base. This results in differences in end-capillary contents for these gases. End-capillary Po2 is lower, and consequently the O2 content is lower in end-capillary blood at the lung base than at the apex. In addition, there is significant variation in blood pH in the end capillaries in these regions because of the variation in CO2 content. During exercise, blood flow to the apex increases and becomes more uniform in the lung; as a result, the difference between the content of gases in the apex and in the base of the lung diminishes with exercise.
|
| page 457 | | | page 458 |
- The sum of the partial pressures of a gas is equal to the total pressure. The partial pressure of a gas (Pgas) is equal to the fraction of the gas in the gas mixture (Fgas) times the total pressure (Ptot). The conducting airways do not participate in gas exchange. Therefore, the partial pressures of O2, N2, and water vapor in humidified air remain unchanged in the airways until the gas reaches the alveolus. The partial pressure of O2 in the alveolus is given by the alveolar air equation. This equation is used to calculate AaDo2, the most useful measurement of abnormal arterial O2.
- The relationship between CO2 production and alveolar ventilation is defined by the alveolar CO2 equation. There is an inverse relationship between the partial pressure of CO2 in the alveolus (Paco2) and alveolar ventilation (VA), irrespective of the exhaled quantity of CO2. In normal individuals, alveolar Paco2 is tightly regulated to remain constant at around 40 mm Hg.
- The volume of air in the conducting airways is called the anatomic dead space. Dead space ventilation (VD) varies inversely with tidal volume (VT). The total volume of gas in each breath that does not participate in gas exchange is called the physiological dead space ventilation. It includes the anatomic dead space and the dead space secondary to ventilated, but not perfused alveoli.
- The pulmonary circulation is a low-pressure, low-resistance system. The arteries of the pulmonary circulation are thin walled, and they have minimal smooth muscle. The pulmonary vessels are seven times more compliant than the systemic vessels. Recruitment of new capillaries is a unique feature of the lung and allows for adjustments in stress, as in the case of exercise. Pulmonary vascular resistance is the change in pressure from the pulmonary artery (PPA) to the left atrium (PLA) divided by cardiac output (QT). This resistance is about 10 times less than in the systemic circulation.
- There are regional differences in ventilation and perfusion that are due in large part to the effects of gravity. The ventilation-perfusion ratio (also referred to as the V/Q ratio) is defined as the ratio of ventilation to blood flow. In a normal lung, the overall ventilation-perfusion ratio is about 0.8. When ventilation exceeds perfusion, the ventilation-perfusion ratio is greater than 1 (V/Q >1), and when perfusion exceeds ventilation, the ventilation-perfusion ratio is less than 1 (V/Q <1). The V/Q ratio at the top of the lung is high (increased ventilation relative to very little blood flow), whereas the V/Q ratio at the bottom of the lung is very low. In normal individuals breathing room air, the AaDO2 is less than 15 mm Hg.
- There are five mechanisms of arterial hypoxemia: anatomic shunt, physiological shunt, V/Q mismatching, diffusion abnormalities, and hypoventilation. There are two mechanisms of hypercapnia: increase in dead space and hypoventilation. A change in cardiac output is the only nonrespiratory factor that affects gas exchange.
|
|
|