| 38 Hormonal Regulation of Energy Metabolism
|
| This chapter considers the role of hormones in maintaining a constant supply of energy to cells in the body during the digestive and interdigestive periods and during fasting and exercise.
|
| OVERVIEW OF ENERGY METABOLISM
|
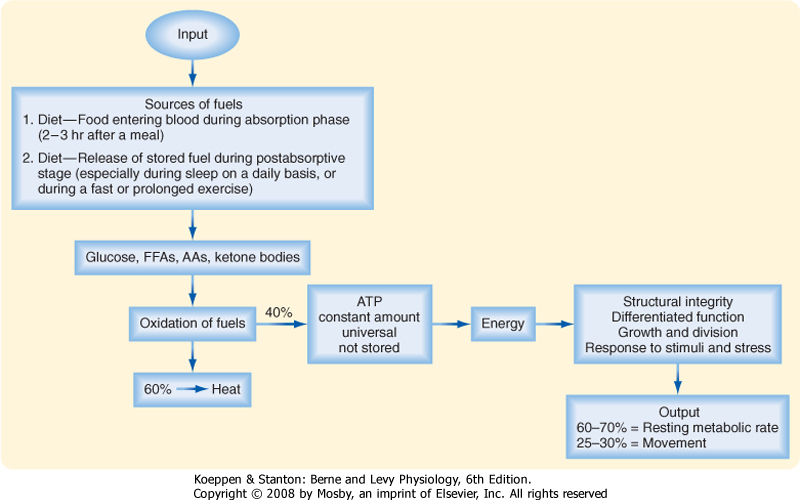
| Cells continually perform work to maintain their integrity and internal environment, respond to stimuli, and perform their differentiated functions (Fig. 38-1). The absolute minimal amount of energy expenditure is called the basal metabolic rate (BMR) or resting metabolic rate (RMR).
|
In an adult, other forms of energy expenditure involve
- Ingestion of food. This causes a small obligate increase in energy expenditure, referred to as diet-induced thermogenesis.
- Nonshivering thermogenesis. This refers to energy expended to produce heat, either in an obligatory manner to maintain a constant thermoneutral state or in a facultative manner when an individual is acutely exposed to cold. All tissues contribute to the obligatory thermogenic process.
- Spontaneous unconscious physical activity such as "fidgeting."
- Occupational labor and purposeful exercise (Table 38-1), which vary greatly among individuals, as well as from day to day and from season to season. Labor and exercise generate the greatest need for variations in daily caloric intake, thus underscoring the importance of energy stores to buffer temporary discrepancies between energy output and intake.
|
| Of a total average daily expenditure of 2300 kcal (9700 kJ) in a sedentary adult, basal metabolism accounts for 60% to 70%, dietary and obligatory thermogenesis for 5% to 15%, and spontaneous physical activity for 20% to 30%. An additional 4000 kcal may be expended in daily physical work. During short periods of occupational or recreational exercise, energy expenditure can increase more than 10-fold over basal levels. Transient and longer-term changes in an individual's physiology, including pregnancy, growth and aging, or infection and cancer, significantly alter energy demands.
|
| Cells derive their energy to perform this work primarily from ATP, which is not stored. Thus, cells need a continual supply of ATP to the extent that humans synthesize well over half their own weight in ATP daily. This is done by oxidizing glucose, free fatty acids (FFAs), amino acids (AAs), and ketone bodies. On average, the process of oxidizing fuels to form ATP is 40% efficient, with 60% lost as heat (Fig. 38-1). All fuels originally come from the diet-humans must eat to stay alive. Normally, people eat intermittently. Consequently, the use and distribution of fuels change over time.
|
| In general, there are four metabolic phases (Fig. 38-1): (1) the digestive or absorptive phase, which occurs during the 2 to 3 hours that it takes to digest a discrete meal; (2) the interdigestive or postabsorptive phase, which normally occurs between meals; (3) fasting, which most commonly occurs between the last snack before bedtime and breakfast (in fact, physicians refer to a blood value as "fasting," e.g., "fasting blood glucose," if the patient abstains from eating after midnight and has blood drawn about 8 AM; prolonged fasting and starvation are extreme forms of fasting); and (4) strenuous exercise or physical labor, which usually imposes an intense energy demand for a relatively short period (e.g., 1 hour).
|
| page 664 |  | | page 665 |
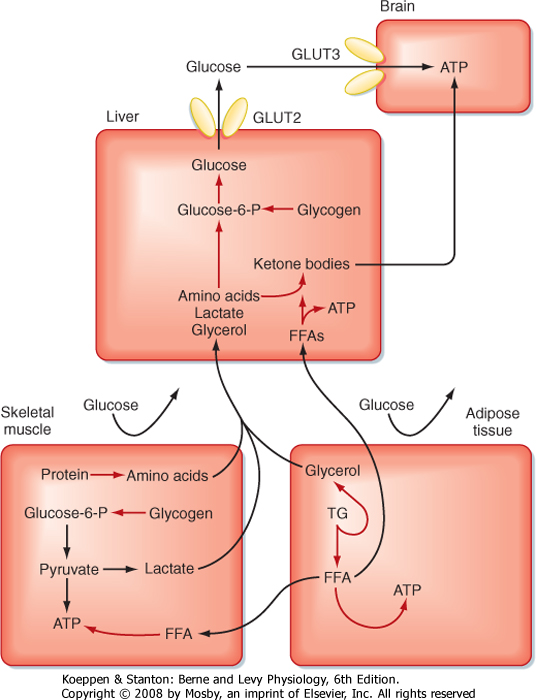
| Figure 38-1 Overview of energy metabolism. |
|
Table 38-1.
Estimates of Energy Expenditure in Adults |
| Activity | Caloric Expenditure (kcal/min) |
| Basal | 1.1 |
| Sitting | 1.8 |
| Walking, 2.5 miles/hr | 4.3 |
| Walking, 4.0 miles/hr | 8.2 |
| Climbing stairs | 9.0 |
| Swimming | 10.9 |
| Bicycling, 13 miles/hr | 11.1 |
| Household domestic work | 2-4.5 |
| Factory work | 2-6 |
| Farming | 4-6 |
| Building trades | 4-9 |
|
Data from Kottke FJ. In Altman PL (ed): Metabolism. Bethesda, MD, Federation of American Society for Experimental Biology, 1968.
|
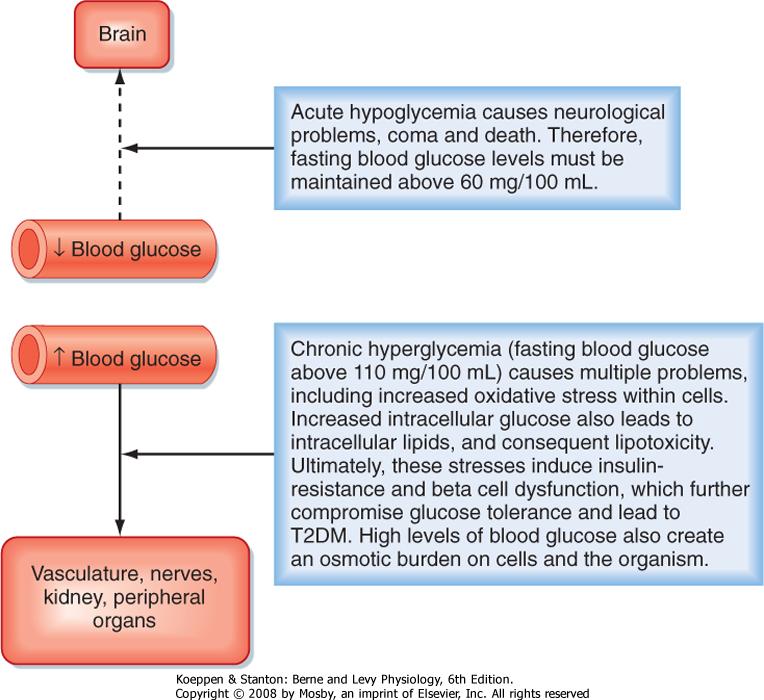
| A central feature of the utilization of different nutrients is the nature of cell-specific needs and capabilities. Cells with no or very few mitochondria cannot utilize AAs and FFAs for energy but must rely entirely on anaerobic glycolysis (see later). The brain, which continually accounts for about 20% of O2 consumption, cannot efficiently access circulating FFAs for energy. The brain converts most of its AA pool into neurotransmitters instead of oxidizing them for energy. This means that the brain and some other tissues are obligate glucose users. In other words, the function of the brain is critically dependent on circulating levels of blood glucose, much as it is on a continuous supply of O2. An acute fall in blood glucose levels below 50 mg/100 mL (i.e., hypoglycemia) leads to impaired central nervous system functions, including vision, cognition, and muscle coordination, as well as lethargy and weakness (Fig. 38-2). Severe hypoglycemia can ultimately lead to coma and death. Thus, a major role of the hormones involved in metabolic homeostasis is to maintain blood glucose levels above
60 mg/100 mL. Conversely, it is important that fasting blood glucose levels remain below 110 mg/100 mL. Indeed, the complications associated with poorly controlled diabetes mellitus have shown not only that too little blood glucose is incompatible with life but also that too much blood glucose imposes various stresses on cell function, increases morbidity, and shortens life (Fig. 38-2).
|
| Thus, a balance must be struck in which a discontinuous caloric intake is matched to the utilization or storage of energy substrates as required by an ever-present but fluctuating energy demand. This balance is achieved through the differential activation and inactivation of selective metabolic pathways during the fed state (i.e., during caloric surplus) versus during the interdigestive period, prolonged fasting, or exercise (i.e., during caloric deficit). Importantly, all organs and tissues cannot simply transport glucose from blood and oxidize it to the same extent at all times. In the following sections we briefly review the primary metabolic pathways involved in the utilization and storage of glucose, FFAs, and AAs. We also discuss a nondietary fuel, ketone bodies, which are made by the liver for use by other organs during fasting.
|
| Making ATP from Carbohydrates
|
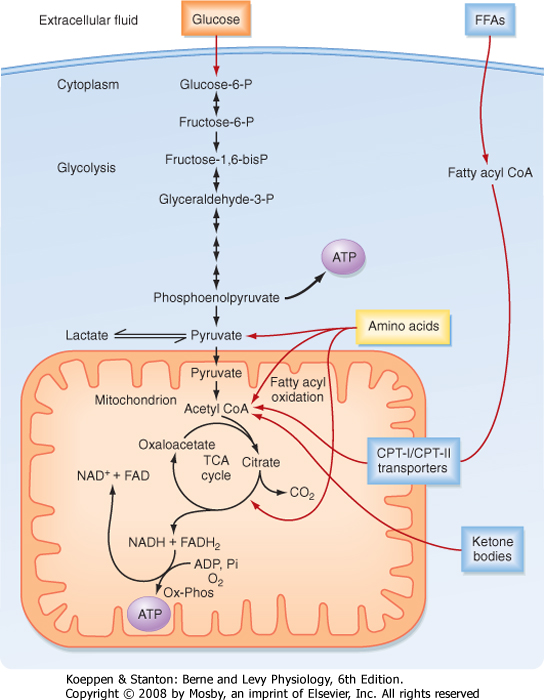
| ATP is generated from the oxidation of carbohydrates, FFAs, and AAs. The primary carbohydrate used by cells is the six-carbon (hexose) monosaccharide glucose. Three main phases are involved in the process of oxidizing glucose to the full extent: (1) transport and trapping of glucose inside the cell; (2) glycolysis (i.e., splitting [lysis] of the six-carbon molecule glucose [glyco]) to the three-carbon molecules pyruvate (aerobic) or lactate (anaerobic); and (3) the tricarboxylic acid (TCA) cycle, which occurs in the inner mitochondrial matrix in close proximity to components of the electron transport chain, and oxidative phosphorylation.
|
| page 665 | | | page 666 |
| Figure 38-2 Importance of maintaining blood glucose within the normal range. (Modified from Porterfield SP, White BA: Endocrine Physiology, 3rd ed. Philadelphia, Mosby, 2007.) |
| Glucose is a hydrophilic molecule and, as such, cannot diffuse across cell membranes. The two families of glucose transporters are the sodium-glucose cotransporters (SGLTs) and the facilitated-diffusion GLUT transporters. SGLTs are localized in the apical membranes of simple epithelia (intestine and proximal tubules of the kidney) and are involved in the transepithelial transport of glucose. GLUTs provide for sodium-independent transmembrane transport of glucose by facilitated diffusion. GLUT1 and GLUT3 are widely expressed and are high-affinity, low-capacity transporters. These GLUT isoforms are linked to high-affinity hexokinases. Hexokinases phosphorylate glucose to form glucose-6-phosphate (G6P). Because G6P does not bind to GLUTs, G6P cannot leave the cell. Consequently, the hexokinase reaction commits glucose to metabolic pathways. GLUT2 is a low-affinity, high-capacity isoform expressed in the liver, pancreatic islet beta cell, and basolateral side of intestinal and renal tubule cells. In the liver and beta cells, GLUT2 is coupled to a low-affinity isoform of hexokinase called glucokinase. GLUT2 and glucokinase play critical roles during the digestive phase, when blood glucose levels are high. Expression and membrane localization of GLUT1, GLUT2, and GLUT3 are independent of insulin. In contrast, GLUT4 is an insulin-dependent GLUT that is expressed primarily in skeletal muscle and adipose tissue. It resides in the membranes of cytoplasmic vesicles. In response to insulin signaling, GLUT4 is inserted into the plasma membrane. GLUT4 plays a central role in "glucose tolerance," which is the ability of insulin to prevent excessive increases in blood glucose during and after a meal. In muscle, GLUT4 is coupled to the activity of hexokinase I and II. Hexokinase II gene expression is rapidly increased by insulin. Thus, insulin promotes the uptake of glucose by muscle and its rapid phosphorylation to G6P. |
|
| In the first phase (Fig. 38-3), glucose is transported across the cell membrane by bidirectional facilitative glucose transporters called GLUTs. Once inside the cell, glucose is prevented from exiting by phosphorylation to glucose-6-phosphate (G6P). This phosphorylation is catalyzed by hexokinases. The hexokinase that is expressed in the liver and pancreatic beta cells
has low affinity for glucose (i.e., it transports glucose only when glucose is available at elevated concentrations) and is designated glucokinase.
|
| The second phase involves glycolysis (Fig. 38-3), which occurs in the cytoplasm. Glycolysis yields a net production of 2 mol of ATP/mol of glucose while consuming the required cofactor NAD+ by reducing it to NADH. In the presence of robust oxidative phosphorylation (relative to the rate of glycolysis), NADH is converted back to NAD+ in an O2-dependent manner, and pyruvate is the primary product of glycolysis (oxidative glycolysis). If the cell has no or very few mitochondria (e.g., erythrocytes, lens of the eye), oxidative phosphorylation cannot be carried out and used to oxidize NADH back to NAD+. In this case, the cell regenerates NAD+ by reducing pyruvate to lactate by the process of anaerobic glycolysis.
|
| page 666 | | | page 667 |
| Figure 38-3 ATP is made from glucose, AAs, FFAs, and ketone bodies. (Modified from Porterfield SP, White BA: Endocrine Physiology, 3rd ed. Philadelphia, Mosby, 2007.) |
| During the third process (Fig. 38-3), pyruvate enters the mitochondria and is converted to acetyl coenzyme A (acetyl CoA). Acetyl CoA is then further metabolized in the TCA cycle and the closely coupled process of oxidative phosphorylation via the electron transport chain. This second stage of oxidation yields almost 20 times more ATP than glycolysis does. Thus, the TCA cycle and oxidative phosphorylation are very efficient means of generating ATP from glucose. However, molecular O2 is required. This is why humans need to breathe air, and oxidative phosphorylation can proceed only as fast as the respiratory and cardiovascular systems can deliver O2 to tissues. Therefore, even
tissues with mitochondria rely on anaerobic glycolysis for some needs. The process of oxidative phosphorylation is also a major contributor to the generation of reactive oxygen species (ROS), which impose oxidative stress that is harmful to cells.
|
| Making ATP from Free Fatty Acids
|
| The other two energy substrates, FFAs and AAs, bypass glycolysis and ultimately enter the TCA cycle/oxidative phosphorylation as pyruvate, acetyl CoA, or different components of the TCA cycle. FFAs are released from adipose tissue by lipolysis and circulate in blood bound to serum albumin. Transport proteins then translocate FFAs into cells. FFAs are metabolized in mitochondria by the repetitive, cyclic process of β oxidation (Fig. 38-3). This requires the transport of FFAs into the inner mitochondrial matrix by the carnitine palmitoyltransferase (CPT-I and CPT-II) system of transporters. Each cycle of β oxidation removes two carbon moieties at a time from FFA chains and generates a molecule of acetyl CoA, which is oxidized through the TCA cycle and oxidative phosphorylation. In addition to the generation of acetyl CoA, each cycle of β oxidation generates 1 molecule each of FADH2 and NADH, thereby producing up to 17 ATP molecules via oxidative phosphorylation. Thus, FFAs are a more efficient source of energy storage than carbohydrates in that the cell can obtain more ATPs per carbon from FFAs than from glucose.
|
| Making ATP from Amino Acids
|
| AAs can also be oxidized after transamination (transfer of their amino group to another molecule). The carbon skeletons of AAs converge on the TCA cycle by conversion to intermediates, including pyruvate, acetyl CoA, α-ketoglutarate, succinyl CoA, fumarate, and oxaloacetate (Fig. 38-3). The amino group of AAs can give rise to ammonia, a highly toxic substance. Thus, the use of AAs for energy must be coupled to the urea cycle in the liver, which converts ammonia to urea.
|
| Making ATP from Ketone Bodies
|
| page 667 | | | page 668 |
| Ketone bodies are four-carbon molecules that include acetoacetate and β-hydroxybutyrate. Ketone bodies do not exist in the diet at significant levels, as do carbohydrates, fats, and AAs. Rather, ketone bodies represent
a fourth class of fuel that is synthesized from acetyl CoA in the liver and exported into the bloodstream for other organs to use. Extrahepatic tissues convert ketone bodies back to acetyl CoA by using succinyl CoA as a CoA donor and the enzyme thiophorase (Fig. 38-4). The liver itself lacks thiophorase and thus cannot use ketone bodies for its own energy needs.
|
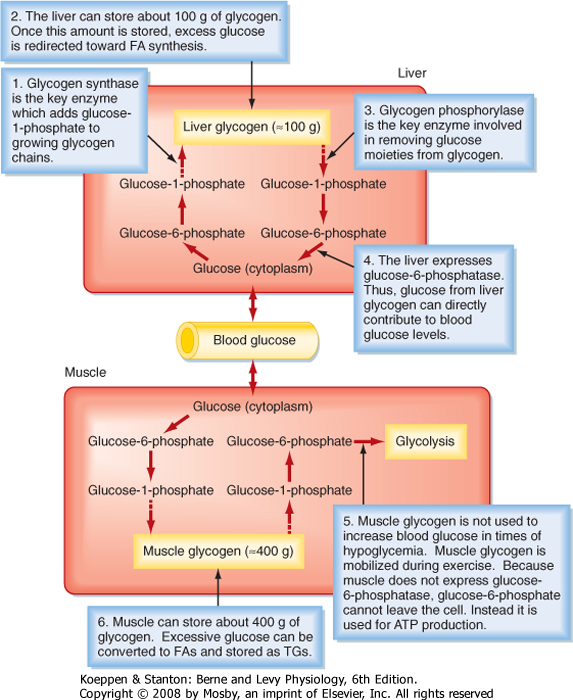
| In general, nutrients are stored during the fed state. Glucose can be stored as glycogen, which is a large polymer of glucose molecules. Once glucose is trapped in cells as G6P, it can be converted to glucose-1-phosphate, which is then added to glycogen chains by two repetitive reactions. The primary, regulated enzyme in glycogenesis is glycogen synthase (Fig. 38-5).
|
| Figure 38-4 Production of ketone bodies in the liver and their utilization by peripheral tissues. (Modified from Porterfield SP, White BA: Endocrine Physiology, 3rd ed. Philadelphia, Mosby, 2007.) |
| During the interdigestive period, individual glucose moieties can be cleaved from glycogen and metabolized back to G6P (Fig. 38-5). The primary enzyme in glycogenolysis is called glycogen phosphorylase. In the liver, G6P can be further converted to glucose by glucose-6-phosphatase (G6Pase), and the glucose that is generated can be transported out of the cell by the bidirectional GLUT2 transporter. Thus, liver glycogen can directly contribute to blood glucose levels. Muscle does not express G6Pase, so glycogenolysis is linked to intramyocellular glycolysis. Muscle glycogen can contribute to blood glucose indirectly. Muscle glycolysis generates lactate, which is converted back to glucose by the liver through the process of gluconeogenesis (see later).
|
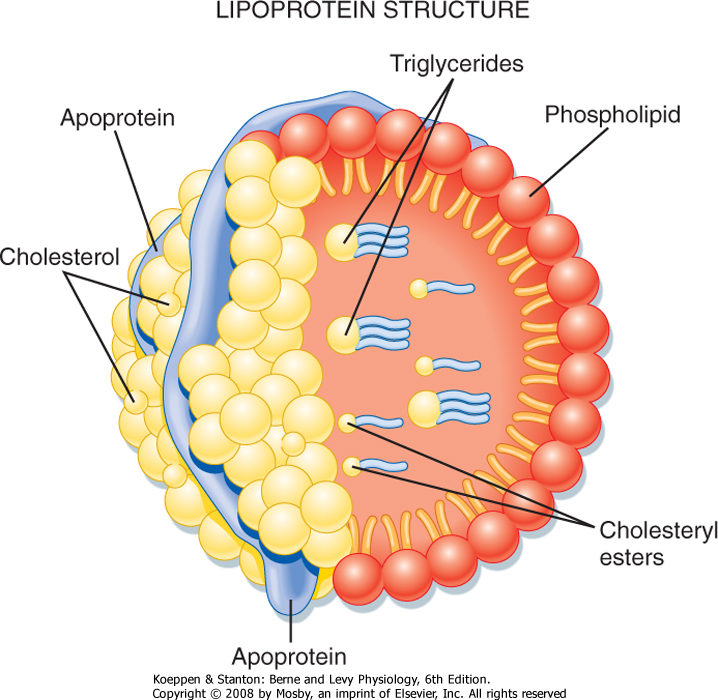
| Triglyceride (TG) represents the storage form of nutrient lipid (e.g., FFAs). TG is obtained from the diet or synthesized endogenously by the liver in the face of caloric excess. Each molecule of TG is composed of three fatty acid chains in an ester linkage to each of the three carbons of glycerol. TG can be stored in most tissues, but only adipose tissue has evolved as a safe and efficient storage depot for TG. Significant TG accumulation in other organs (cardiac muscle, liver) can compromise their physiological functions and cause cell death. Accumulation of TG in skeletal muscle and liver also promotes insulin resistance and glucose intolerance. Thus, the body has developed transport mechanisms for the delivery of dietary and endogenously synthesized TGs to adipose tissue. These transport mechanisms involve the assembly of lipoprotein particles, which entails coating hydrophobic TG and cholesterol esters with relatively more hydrophilic (or amphipathic) free cholesterol and phospholipids (Fig. 38-6). Lipid-soluble vitamins (e.g., vitamins E, A, D, and K) also associate with lipoproteins. Specific apoproteins, as well as enzymes and transfer proteins, become associated with the surface of lipoprotein particles both before secretion and during transit in blood. The protein complement of lipoprotein particles is absolutely required for their specific function or functions and metabolic clearance. Lipoproteins are summarized in Table 38-2.
|
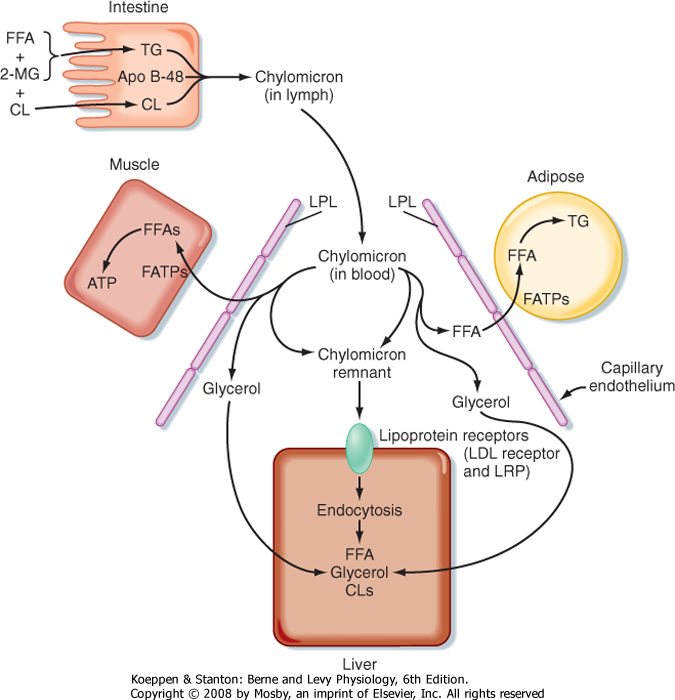
| Most of the TG stored in adipose tissue originates from the diet. Dietary TGs are digested by lipases in the intestinal lumen and are absorbed by intestinal cells as FFAs and 2-monoglycerides. These components are reassembled into TGs within enterocytes. The intestinal cells package TGs into a lipoprotein particle called a chylomicron, which enters the villar lymphatics (Fig. 38-7). The intestinal lymphatics bypass the hepatic portal circulation and the liver and empty into the general circulation. Once in blood, chylomicrons travel to adipose tissue, skeletal muscle, and cardiac muscle, where TGs are unloaded as FFAs and glycerol.
|
| page 668 | | | page 669 |
| Figure 38-5 Glycogen synthesis and breakdown serve different needs in liver versus muscle. (Modified from Porterfield SP, White BA: Endocrine Physiology, 3rd ed. Philadelphia, Mosby, 2007.) |
| Figure 38-6 The lipoprotein particle. The external monolayer of the particle contains free cholesterol, phospholipids, and apoproteins. The very hydrophobic cholesterol esters and TGs concentrate within the particle core. Lipoproteins also carry fat-soluble vitamins. (From Baynes JW, Dominiczak MH: Medical Biochemistry, 2nd ed. Philadelphia, Mosby, 2005.) |
| page 669 | | | page 670 |
|
Table 38-2.
Characteristics of Different Lipoprotein Particles |
| Particle | Main Lipid Component | Apoproteins | Function | Promotes Atherosclerosis |
| Chylomicron | TG | B-48 (A, C, E) | Transports dietary TG to adipose (and other) tissue | No |
| Chylomicron remnant | TG | B-48 (A, C, E) | Delivers leftover dietary TG to the liver
Exchanges TG for CE from HDL and delivers CE to the liver | Yes |
| VLDL | TG | B-100 (A, C, E) | Transports endogenously synthesized TG to adipose tissue and skeletal and cardiac muscle
Exchanges TG for CE from HDL | No |
| IDL (VLDL remnant) | TG and cholesterol | B-100, E | Delivers leftover TG and cholesterol to the liver
Exchanges TG for CE from HDL and delivers CE to the liver | Yes |
| LDL | Cholesterol | B-100 | Delivers cholesterol to the liver, steroidogenic cells, and dividing cells | Yes |
| HDL | Cholesterol | As (C, E) | Accepts cholesterol from peripheral cells, esterifies it, and transports cholesterol esters to the liver | No |
| | | | Exchanges cholesterol esters for TG in VLDL, IDL, and chylomicron remnants
Atheroprotective through several mechanisms, including carrying enzymes (paraoxonase) that inhibit LDL oxidation
Acts as a reservoir of circulating apolipoproteins (A, C, and E) for transfer to other lipoprotein particles | Atheroprotective |
|
| Figure 38-7 Dietary fats are conveyed from the small intestine to adipose tissue as chylomicron particles. Dietary FFAs and 2-monoglycerides (2-MGs) are transported into the enterocyte and reesterified into TG. Other complex lipids (cholesterol [CL], cholesterol esters, phospholipids) are complexed with TG and apolipoprotein B-48 (Apo B-48) into chylomicrons. In the capillary beds of adipose tissue, chylomicrons are digested by lipoprotein lipase (LPL), and the released FFAs are transported into adipocytes by fatty acid transporters (FATPs) and reesterified into TGs. In skeletal and cardiac muscle, FFAs are used for energy. The partially digested chylomicron remnants bind to the LDL receptor (LDLR) and its related protein (LRP; via apo E) and are endocytosed by hepatocytes. |
| page 670 | | | page 671 |
| A primary apoprotein on chylomicrons is apo B-48. Secreted chylomicrons acquire additional apoproteins
by transfer of proteins from high-density lipoproteins (HDLs) in blood. For example, Apo C-II is an apoprotein that is exchanged between HDL and chylomicrons. Apo C-II acts as an activator/cofactor of the enzyme lipoprotein lipase (LPL), which digests circulating chylomicrons. LPL is synthesized by adipocytes and muscle cells. It is secreted and ultimately translocated to the apical surface of the endothelium lining neighboring capillaries, to which LPL remains noncovalently attached by heparin sulfate proteoglycans. Dozens of LPL molecules attach to and digest lipoprotein particles, thereby releasing FFAs and glycerol (Fig. 38-7). Several fatty acid transport proteins are involved in the transport of FFAs from the apical surface of endothelial cells to the cytoplasm of neighboring cells. Once FFAs enter a cell, they are immediately converted
to fatty acyl CoAs. In skeletal and cardiac muscle, fatty acyl CoAs are oxidized for production of ATP. In adipocytes, FFAs are stored in the form of TG. Esterification of the first fatty acyl chain requires glycerol-3-phosphate (G3P). Adipocytes do not express glycerol kinase and consequently cannot synthesize G3P directly from the glycerol released from chylomicrons. Instead, adipocytes generate G3P from intermediates of glycolysis. Partially digested, TG-depleted chylomicrons are called chylomicron remnants. These are cleared by the liver through the process of receptor-mediated endocytosis, which requires another apoprotein, apo E. Multiple apo E proteins are transferred to a chylomicron from HDL and bind to the low-density lipoprotein (LDL) receptor and LDL receptor-related protein (LRP) on hepatocyte membranes.
|
| Endogenously Synthesized Triglyceride
|
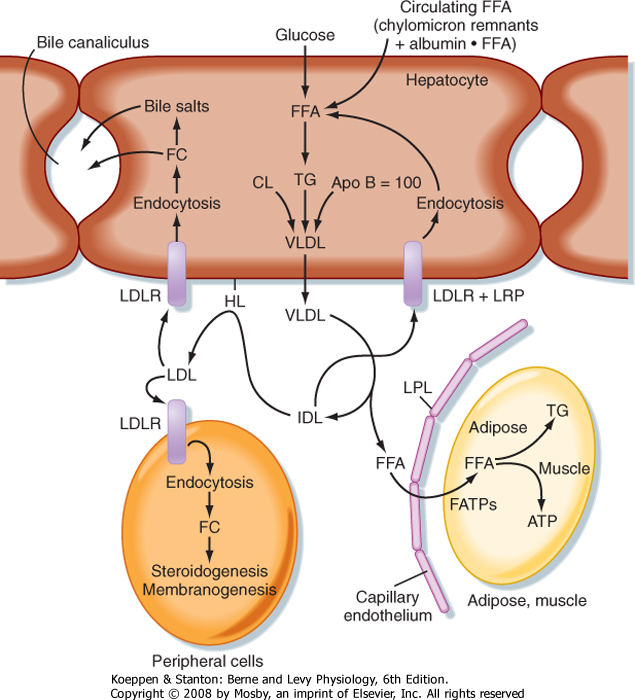
| Figure 38-8 Endogenously synthesized fats are conveyed from the hepatocyte to adipose tissue as very-low-density lipoprotein (VLDL) particles. VLDL is digested by LPL in the capillary beds of adipose tissue, skeletal muscle, and other tissues. Partially digested VLDL (intermediate-density lipoproteins [IDLs]) are further digested by hepatic lipase (HL), thereby generating LDL particles, which are endocytosed via the LDL receptor (LDLR) on peripheral cells and hepatocytes. IDLs are also endocytosed by hepatocytes after binding to the LDLR and LRP. FC, free cholesterol. |
| Familial hyperchylomicronemia syndrome is due to inactivating mutations in LPL or its cofactor apo C-II. In these individuals, TGs cannot be efficiently digested and unloaded from chylomicrons after a lipid-containing meal. Chylomicrons are normally cleared from blood by 12 hours after a meal. In individuals with LPL or apo C-II deficiency, TG-laden chylomicrons persist for days after a single meal. Fasting plasma TG levels are normally below 160 mg/dL, but in affected individuals, plasma TG is typically greater than 1000 mg/dL. Pancreatitis, hepatosplenomegaly (i.e., enlarged liver and spleen because of phagocytosis of chylomicrons by the reticuloendothelial cells of these organs), lipemia retinalis (i.e., opalescent blood vessels in the retina), and eruptive xanthomas (i.e., clusters of yellowish white bumps on the skin) develop in many, but not all patients with familial hyperchylomicronemia syndrome. VLDL (see later) is also increased, but to a lesser extent than chylomicrons. Primary clinical management of this syndrome is dietary fat restriction. Because chylomicrons also deliver lipid-soluble vitamins to the body, vitamin supplementation is also called for. |
|
| page 671 | | | page 672 |
| TGs can also be synthesized from glucose and other precursors of acetyl CoA (Fig. 38-8). This occurs during high caloric intake when liver and muscle glycogen stores are saturated and the supply of glucose exceeds the need for synthesis of ATP (e.g., during the development of diet-induced obesity). The primary site of endogenous FFA and TG synthesis in humans is the liver, usually in response to high levels of glucose. Glucose is metabolized to acetyl CoA and then to citrate in the first reaction of the TCA cycle. However, the presence of high ATP and NADH levels in the well-fed state inhibits progression of the TCA cycle and
causes intramitochondrial levels of citrate to accumulate. Citrate is then translocated to the cytoplasm, where it is converted back to cytosolic acetyl CoA and oxaloacetate. Once in the cytoplasm, acetyl CoA can enter fatty acyl CoA and TG synthesis (see later). Fatty acyl CoAs are esterified to G3P to form monoglycerides, diglycerides, and finally TGs. TGs are not normally stored in the liver to a large extent but are transferred to adipose tissue. Thus, TGs must be packaged by the liver into lipoprotein particles called very-low-density lipoproteins (VLDLs) before being secreted into blood. Like chylomicrons, VLDLs contain a core of very hydrophobic TG and cholesterol esters and a covering of amphipathic phospholipids and free cholesterol. The VLDL particle also contains apo B-100. After secretion, VLDLs acquire other proteins from circulating HDL particles, including apo C-II and apo E, and are digested by LPL within the capillary beds of adipose tissue, as well as skeletal and cardiac muscle (Fig. 38-8).
|
| Partially LPL-digested VLDL particles are called VLDL remnants, or intermediate-density lipoprotein (IDL) particles (Fig. 38-8). IDL has two fates. First, IDL is removed from the circulation by receptor-mediated endocytosis by the LDL receptor (via binding to apo B-100 and apo E) and LRP (via binding to apo E) at the liver. Efficient endocytosis of IDL is dependent on multiple copies of apo E being associated with the remnant particle. Second, IDL is further digested by the ectoenzyme hepatic lipase. This delivers FFAs and glycerol to the liver and transforms the IDL into a TG-poor, cholesterol-rich LDL particle.
|
| Low-Density Lipoprotein and Cholesterol Economy
|
| With the formation of LDL, the nutritional role of lipoproteins (i.e., delivery of TG to adipose tissue or muscle) has largely been completed. This is due to the fact that cholesterol cannot be metabolized by humans for energy. However, cholesterol is used as the backbone for certain molecules and is an important component in cell membranes. Although most cells can synthesize some cholesterol from acetate, LDL is an important source of cholesterol, particularly for cells with a high demand for cholesterol. Quantitatively, hepatocytes that synthesize bile salts have the greatest need for cholesterol and endocytose the largest amount of LDL. Other cell types that have a high demand for cholesterol include steroidogenic cells and growing and proliferating cells that need to synthesize new cell membrane. In fact, some aggressively growing cancers import LDL cholesterol to the extent that circulating levels of cholesterol fall well below normal (hypocholesterolemia).
|
| Familial hypertriglyceridemia is due to increased VLDL production, decreased VLDL clearance, or both. This condition is associated with elevated plasma TG (250 to 1000 mg/dL), reduced HDL, but not usually an increased risk of peripheral or coronary atherosclerosis or cardiovascular disease (see later). In some cases, familial hypertriglyceridemia progresses to decreased clearance of chylomicrons (i.e., hyperchylomicronemia). In the latter case, patients experience eruptive xanthomas and pancreatitis, but not usually cardiovascular disease. Diet-induced obesity, alcoholism, insulin resistance, and type 2 diabetes (see later) are factors that increase VLDL production by the liver and can exacerbate this condition. |
| Abetalipoproteinemia is due to a mutation in the gene encoding microsomal transfer protein (MTP). MTP is required for proper packaging of lipids with apoproteins during the formation of chylomicrons and VLDL. Affected individuals have extremely low plasma TG and cholesterol and no circulating chylomicrons, VLDL, or apo B. The inability to synthesize chylomicrons leads to fat malabsorption and diarrhea in early childhood. In affected individuals, neurological disorders such as spinocerebellar degeneration and pigmented retinopathy can develop and cause several neurological symptoms, including ataxia (i.e., loss of coordination) and a spastic gait. The neurological disorders are due to malabsorption of fat-soluble vitamins, especially vitamin E (but also vitamins A and K). Thus, early diagnosis and early vitamin supplementation, along with a high-calorie, low-fat diet, can prevent the development of neurological sequelae. |
| Diet-induced obesity, especially when associated with central (visceral) obesity, can overwhelm the liver with an influx of FFAs via the hepatic portal vein. This is further exacerbated by the insulin resistance of obesity, which allows increased lipolysis and release of FFAs from adipose tissue. Diet-induced obesity and the associated insulin resistance also lead to an inability of skeletal muscle to effectively lower the typically high carbohydrate load after a meal (i.e., glucose intolerance). Thus, the liver, which always accepts glucose via the insulin-independent, high-capacity GLUT2 transporter (coupled to a high-capacity glucokinase), is exposed to an increased burden of intrahepatic glucose that is converted to FFAs and TG. The influx of FFAs and glucose can exceed the ability of the liver to package lipids into VLDL for secretion and transport to adipose tissue. Under these conditions, the liver begins to store increasing amounts of TG, which leads to hepatic steatosis (fatty liver) and can progress to nonalcoholic steatotic hepatitis (NASH). |
|
| page 672 | | | page 673 |
| LDL particles deliver cholesterol to cells through binding of apo B-100 to the LDL receptor, followed by receptor-mediated endocytosis. In the transition of IDL to LDL, the LDL loses apo E. This means that LDL cannot be cleared from blood through apo E-dependent binding to LRP, only through apo B-100-dependent binding to the LDL receptor. Quantitatively, the primary site of LDL endocytosis is the liver, which is
also the site of cholesterol excretion. About 1 g of cholesterol is excreted daily by the liver-50% as cholesterol and 50% as bile salts. The liver is also the primary site of cholesterol synthesis. Importantly, the synthesis of cholesterol and uptake of LDL cholesterol
are highly regulated in a negative-feedback loop. Therefore, the daily amount of cholesterol synthesis (about 1 g) is modulated by the amount absorbed from the diet (about 250 mg/day), so changes in dietary cholesterol normally have a relatively small effect on total circulating and LDL cholesterol.
|
| High-Density Lipoprotein and Reverse Cholesterol Transport
|
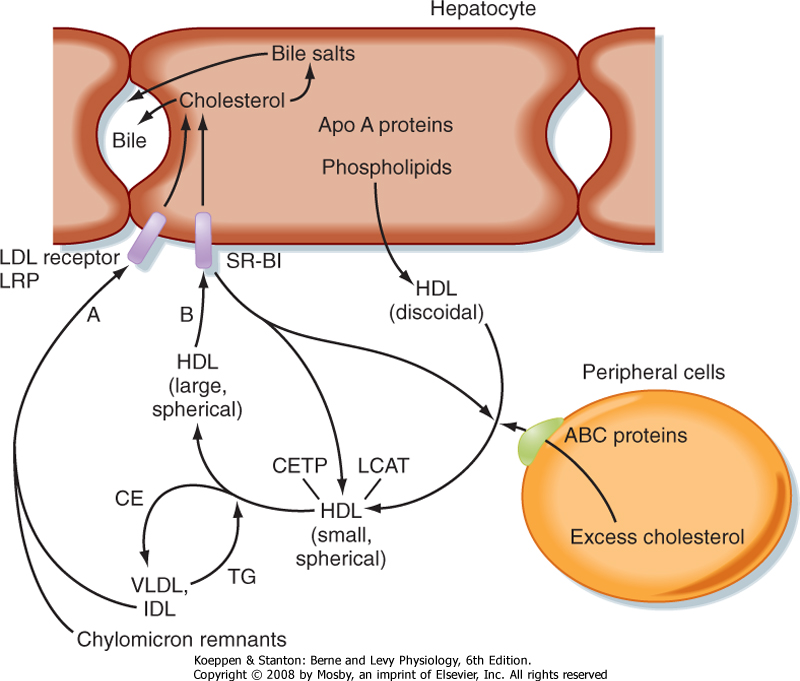
| Because cells cannot break cholesterol down, they intermittently need to discharge cholesterol (Fig. 38-9). There is also a need for macrophages that ingest oxidized LDL to rid themselves of excess cholesterol before they become foam cells and die. The efflux of cholesterol from cells is facilitated by ATP-binding cassette (ABC) proteins, most notably ABCA1. The cholesterol that is transferred out of cells is accepted by nascent HDL. Nascent HDL is produced by the liver and small intestine and is composed of apo A-I, phospholipids (primarily lecithin), and the enzyme lecithin-cholesterol acyltransferase (LCAT). LCAT esterifies cholesterol, and the cholesterol esters accumulate within the center of the maturing spherical HDL (HDL3). Mature HDL can return cholesterol to the liver for excretion (i.e., reverse cholesterol transport) via two pathways. First, HDL can transfer cholesterol esters to TG-rich VLDL, IDL, and chylomicron remnants through the action of an HDL-associated protein, cholesterol ester transfer protein (CETP). This is done in exchange for TG, which produces a larger HDL particle (HDL2). The cholesterol-enriched IDL and chylomicron remnants are then endocytosed by the liver through apo E-dependent binding to the LDL receptor and LRP. The second pathway involves apo A-I-dependent binding to the scavenger receptor BI (SR-BI) on the hepatocyte membrane. This allows the transfer of cholesterol esters from HDL into the hepatocyte membrane. Cholesterol esters are then cleaved by hepatic hormone-sensitive lipase, and the free cholesterol enters the bile salt pathway or is excreted as cholesterol. Larger, TG-enriched HDL is first processed by hepatic lipase, which decreases its size and enhances its binding to SR-BI.
|
| In addition to the role of HDL in reverse cholesterol transport, HDL has several other atheroprotective actions. For example, other enzymes associated with HDL (e.g., paraoxonase) inhibit oxidation of LDL in the intima of blood vessels. HDL also increases nitric oxide synthesis by endothelial cells. Thus, HDL plays a major atheroprotective role, which explains why the ratio of LDL to HDL is an important consideration when assessing a patient's blood chemistry in terms of risk for cardiovascular disease.
|
| Catabolism of Triglycerides in Adipose Cells
|
| LDL is relatively small (about 30 nm in diameter). As such, LDL can gain entry into the subendothelial intima of blood vessels at sites of minimal endothelial damage. In this environment, the outer components of LDL (i.e., phospholipids, cholesterol, apo B-100) become oxidized. Oxidized LDL has several direct effects on endothelial cells, including a reduction in endothelial viability and their production of the potent vasodilator and atheroprotective substance nitric oxide. Additionally, oxidized apo B-100 binds to scavenger receptors on macrophages, which then endocytose oxidized LDL. Scavenger receptors are not down-regulated by their cargo (oxidized LDL) or by the intracellular byproducts of oxidized LDL. As a consequence, macrophages can become engorged with oxidized LDL. These cholesterol-filled macrophages, called foam cells, eventually die and release large amounts of cholesterol into the intima. The released pools of cholesterol from many foam cells promote the development of atherosclerotic plaque. Oxidized LDL may also contribute to a mounting inflammatory reaction within the intima involving movement of immune cells into the intima, release of cytokines and chemoattractants, and proliferation and migration of vascular smooth muscle cells into the intima. |
| Familial hypercholesterolemia is due to mutations in the LDL receptor. These mutations (many hundreds have been characterized) impair the ability of the liver to clear LDL cholesterol from blood. Thus, total cholesterol and LDL cholesterol are elevated, whereas TG is normal. Affected individuals are prone to the development of cutaneous xanthomas and are at extreme risk for atherosclerosis and cardiovascular disease. In fact, untreated, homozygous patients rarely survive to 30 years of age. Treatment is LDL apheresis, which involves physical removal of LDL from blood. Autosomal recessive hypercholesterolemia is due to mutations in the ARH protein, a scaffolding protein that links the LDL receptor to clathrin-dependent endocytosis. |
| Insulin resistance and type 2 diabetes mellitus (see later) are often characterized by dyslipidemia, especially in association with central (visceral) obesity, hypertension, and cardiovascular disease. This constellation of metabolic derangements is collectively referred to as metabolic syndrome. The liver produces larger than normal VLDL particles, which are very efficiently processed by LPL and hepatic lipase and ultimately give rise to small, dense LDL particles that are highly atherogenic. Atherosclerosis is key to development of the hypertension (decreased nitric oxide synthesis, decreased arterial compliance) and coronary heart disease (blockage of coronary arteries by plaque) of metabolic syndrome. A major pharmacological treatment to lower LDL cholesterol is the use of statins. These drugs inhibit the rate-limiting enzyme in cholesterol biosynthesis (i.e., HMG-CoA reductase). Less intracellular cholesterol is sensed by the transcription factor sterol responsive element-binding protein (SREBP-2), which up-regulates the expression of HMG-CoA reductase, as well as the LDL receptor. On balance, less LDL cholesterol is made, and more LDL cholesterol is cleared by the liver. |
|
| page 673 | | | page 674 |
| Figure 38-9 Reverse cholesterol transport is mediated by HDL particles. Excess cholesterol in extrahepatic cells is transported out of the cell by ATP-binding cassette (ABC) proteins and onto discoidal HDL particles, thereby generating small, spherical HDL particles. Cholesterol is esterified by the enzyme lecithin-cholesterol acyltransferase (LCAT). Cholesterol esters (CEs) and TGs are exchanged between VLDL, IDL, and chylomicron remnants and HDL through the activity of cholesterol ester transfer protein (CETP). As HDLs take on TG, they become large, spherical HDL particles. HDL transfers its CEs to the liver through interaction with the HDL receptor, called scavenger receptor B1 (SR-B1). Cholesterol is then secreted in bile, either as cholesterol or as bile salts. The HDL particles are recycled. |
| Mutations in apo A-I result in complete absence of HDL, which gives rise to increased coronary heart disease. Because apo A-I is a cofactor for LCAT, total blood and cellular free cholesterol is increased and leads to corneal opacities and planar xanthomas. Other mutations in apo A-I increase the rate of clearance of HDL. Interestingly, these patients have low plasma HDL and HDL cholesterol but are not at increased risk for cardiovascular disease. Fibrates are ligands for the transcription factor peroxisome proliferation activator receptor α (PPARα) (see later), which stimulates hepatic synthesis of apo A-I. Thus, fibrates can be used to increase circulating HDL. A more recently discovered member of the PPAR family, PPARδ/β, also strongly increases apo A production. However, exogenous ligands for PPARδ/β are not yet approved for use in humans. |
|
| During a fast, TGs are catabolized back to FFAs and glycerol. This is initiated by the action of a hormone-sensitive lipase, followed by additional lipases that remove the second and third fatty acyl groups. The net amount of TG versus FFAs in adipose tissue is thus determined by the balance of TG synthesis and lipolysis, which is extremely sensitive to hormonal signals.
Hydrophobic FFAs are transported in blood mostly in FFA-albumin complexes. FFAs are actively transported into cells, which divert FFAs into β oxidative pathways for energy or, in the case of the liver, into ketone bodies (Fig. 38-4). This latter fate of FFAs is important during a prolonged fast because unlike FFAs, ketone bodies in sufficient levels can cross the blood-brain barrier.
|
| Unlike TG stored in depot fat, proteins perform many dynamic functions other than storage of energy. Nevertheless, proteins are metabolically active and can be hydrolyzed when needed to produce AAs, which can then be oxidized for energy or used to make glucose (see the following section on gluconeogenesis), FFAs, or ketone bodies. Under fasting conditions, protein synthesis is reduced, whereas protein breakdown is enhanced. For AAs to be used for energy, their amino groups must be converted to urea to prevent buildup of toxic ammonia.
|
| GLUCONEOGENESIS: SYNTHESIZING GLUCOSE FROM GLYCEROL, LACTATE, AND AMINO ACIDS
|
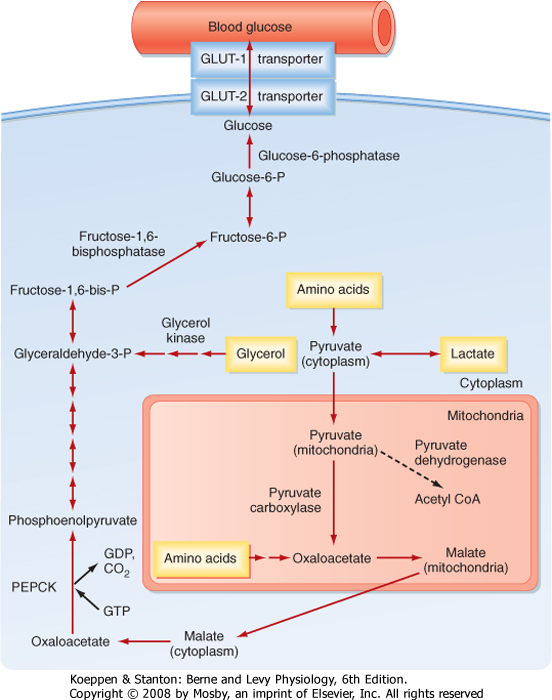
| Breakdown of glycogen is a transient way by which the liver can contribute directly to blood glucose levels. The liver and, to a lesser extent, the kidney can also produce glucose for a much longer period by converting glycerol, lactate, and AAs into glucose. Pyruvate or TCA intermediates that can generate oxaloacetate are glucogenic. A major glucogenic molecule is pyruvate, which is directly converted to oxaloacetate by pyruvate carboxylase (Fig. 38-10). Oxaloacetate escapes the mitochondria as malate, which is then reoxidized to oxaloacetate. Oxaloacetate is converted to phosphoenolpyruvate (PEP) by the enzyme PEP carboxykinase (PEPCK). PEP is subsequently converted to fructose-1,6-bisphosphate via the reversible reactions of glycolysis. In the presence of a high ATP/AMP ratio, the enzyme fructose-1,6-bisphosphatase is active; it generates fructose-6-phosphate (F6P) and then reversibly converts it to G6P, which is dephosphorylated by G6Pase and released into blood through the bidirectional GLUT2 transporter.
|
| Importantly, acetyl CoA cannot be used to make glucose. This means that FFAs, ketone bodies, and certain AAs cannot directly contribute to blood glucose levels. However, the utilization of FFAs has a glucose-sparing effect because during prolonged fasting, ketone bodies eventually reach levels sufficient to be used by the brain, thereby reducing the glucose required for the brain.
|
| page 674 | | | page 675 |
| Figure 38-10 Gluconeogenesis. The liver expresses key enzymes that can use AAs, glycerol, and lactate to synthesize glucose in order to maintain blood glucose levels. (Modified from Porterfield SP, White BA: Endocrine Physiology, 3rd ed. Philadelphia, Mosby, 2007.) |
| SUMMARY OF KEY METABOLIC PATHWAYS
|
| ATP is the primary source of energy in all cells. The body can make ATP from carbohydrates, FFAs, AAs, and ketone bodies. However, the brain is exclusively dependent on glucose, except after days of fasting, when it can metabolize ketone bodies. As hunter-gatherers, humans evolved to efficiently store excess calories as glycogen, TGs, and protein during a meal and release stored energy substrates as needed during fasting or for physical activity (or both). Additionally, in times of a fast, the liver can convert substrates to ketone bodies for use by other organs (especially the brain). The enzymatic pathways that coordinate the partitioning of energy stores during a meal and their utilization between meals and during exercise are regulated by nutrient status, autonomic innervation, and key hormones. Before discussing how hormones regulate these pathways, we first need to learn about the hormones themselves.
|
| KEY HORMONES INVOLVED IN METABOLIC HOMEOSTASIS
|
| Endocrine Pancreatic Hormones
|
| page 675 | | | page 676 |
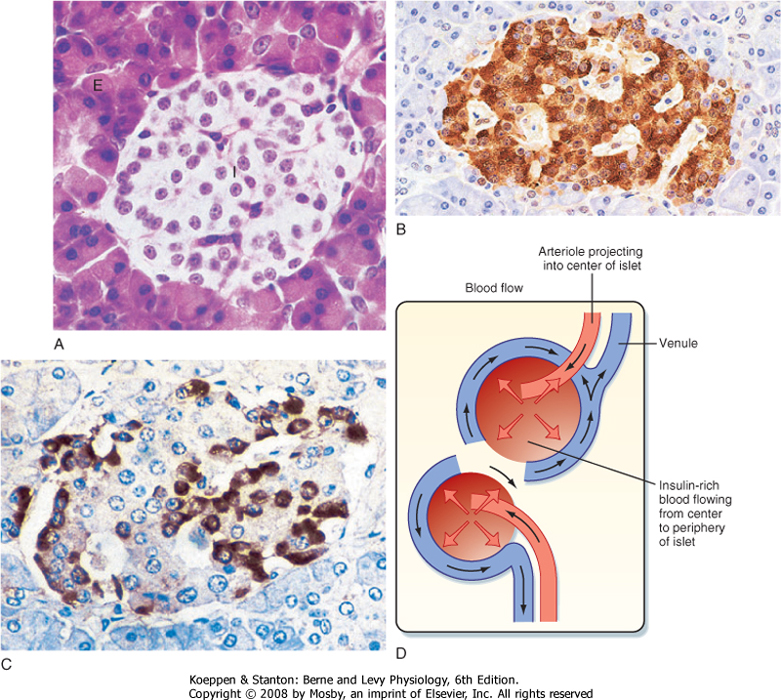
| Figure 38-11 A, Histological section of a pancreas showing an islet of Langerhans (I) surrounded by the exocrine pancreas (E). (From Young B et al: Wheater's Functional Histology, 5th ed. London, Churchill Livingstone, 2006). A human islet stained by immunohistochemical methods shows the predominance and central core location of (B) beta cells (insulin) and (C) the peripheral distribution of alpha cells (glucagon). (From Stevens A, Lowe J: Human Histology, 3rd ed. Philadelphia, Mosby, 2004.) D, Drawing showing arterial blood flowing into the center of an islet and then percolating centrifugally toward the periphery of the islet. |
| The islets of Langerhans constitute the endocrine portion of the pancreas (Fig. 38-11). Approximately 1 million islets, making up about 1% to 2% of the pancreatic mass, are spread throughout the pancreas. The islets are composed of several cell types, each producing a different hormone. In islets situated in the body, tail, and anterior portion of the head of the pancreas, the most abundant cell type is the beta cell (also called B cell). Beta cells make up about three fourths of the cells of the islets and produce the hormone insulin. Alpha (A) cells account for about 10% of these islets and secrete glucagon. The third major cell type of the islets within these regions is the delta (D) cell, which makes up about 5% of the cells and produces the peptide somatostatin. A fourth cell type, the F cell, constitutes about 80% of the cells in the islets situated within the posterior portion of the head of the pancreas
(including the uncinate process); it secretes the peptide pancreatic polypeptide. Because the physiological function of pancreatic polypeptide in humans remains obscure, it will not be discussed further.
|
| Blood flow to the islets is somewhat autonomous from blood flow to the surrounding exocrine pancreatic tissue. Blood flow through the islets passes from beta cells, which predominate in the center of the islet, to alpha and delta cells, which predominate in the periphery (Fig. 38-11). Consequently, the first cells affected by circulating insulin are the alpha cells, in which insulin inhibits glucagon secretion.
|
| page 676 | | | page 677 |
| Insulin is the primary anabolic hormone that is responsible for maintaining the upper limit of blood glucose and FFA levels. Insulin achieves this objective by promoting glucose uptake and utilization by muscle and adipose tissue, increasing glycogen storage in liver and muscle, and reducing glucose output by the liver. Insulin promotes protein synthesis from AAs and inhibits protein degradation in peripheral tissues. Insulin also promotes TG synthesis in the liver and adipose tissue and represses lipolysis of adipose TG stores. Finally, insulin regulates metabolic homeostasis through effects on satiety. Partial or complete loss
of insulin's action results in severe hyperglycemia, dyslipidemia, and diabetes mellitus.
|
| Structure, Synthesis, and Secretion
|
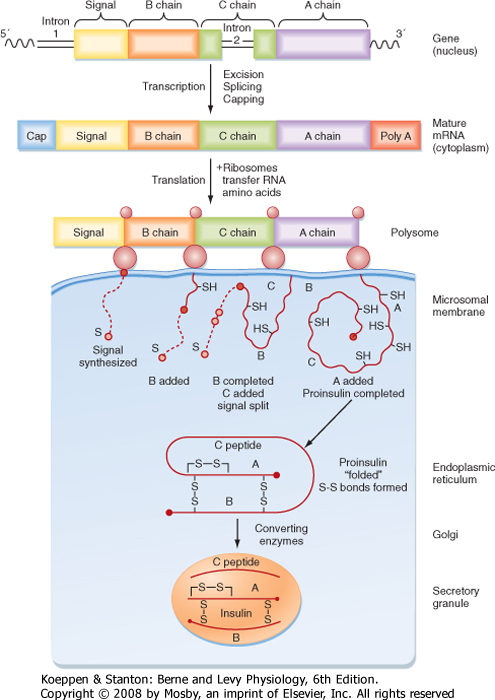
| Insulin is a protein hormone that belongs to the gene family that includes insulin-like growth factors I and II (IGF-I, IGF-II), relaxin, and several insulin-like peptides. The insulin gene encodes preproinsulin. Insulin is synthesized on the polyribosome as preproinsulin, and microsomal enzymes cleave the N-terminal signal peptide to produce proinsulin as the peptide enters the endoplasmic reticulum. Proinsulin is packaged in the Golgi apparatus into membrane-bound secretory granules. Proinsulin contains the AA sequence of insulin plus the 31-amino acid C (connecting) peptide and four linking AAs. The proteases that cleave proinsulin (proprotein convertases 1/3 and 2) are packaged with proinsulin within the secretory granule. The mature hormone consists of two chains, an α chain and a β chain, connected by two disulfide bridges (Fig. 38-12). A third disulfide bridge is contained within the α chain. Insulin is stored in secretory granules in zinc-bound crystals. On stimulation, the granule's contents are released to the outside of the cell by exocytosis.
|
|
| Figure 38-12 Synthesis of insulin. The insulin gene codes for preproinsulin. The mature messenger RNA initiates synthesis of the N-terminal signal peptide (S) in ribosomes, followed by the B, C, and A chains. The signal is degraded during the course of completion of the proinsulin molecule. The latter is folded into a conformation that permits disulfide linkages to form between the A and B chains. Within the Golgi and secretory granule, converting enzymes cleave off the C chain, known as C peptide, thereby completing the synthesis of insulin. The insulin molecules are concentrated in the electrondense core of the granule, whereas the C peptide molecules are in the peripheral halo areas of the granule. (Data from Permutt M et al: Diabetes Care 7:386, 1984; and Steiner DF et al. In Degroot LJ et al [eds]: Endocrinology, vol 2. New York, Grune & Stratton, 1979.) |
| page 677 | | | page 678 |
| Insulin has a half-life of 5 to 8 minutes and is cleared rapidly from the circulation. It is degraded by insulinase in the liver, kidney, and other tissues. Because insulin is secreted into the portal vein, it is exposed to liver insulinase before it enters the peripheral circulation. Consequently, almost half the insulin is degraded
before leaving the liver. Thus, peripheral tissues are exposed to only half the serum insulin concentration as the liver. Recombinant human insulin and insulin analogues with different characteristics of onset and duration of action and peak activity are now available.
|
| Serum insulin levels normally begin to rise within 10 minutes after ingestion of food and reach a peak in 30 to 45 minutes. The higher serum insulin level rapidly lowers blood glucose to baseline values.
|
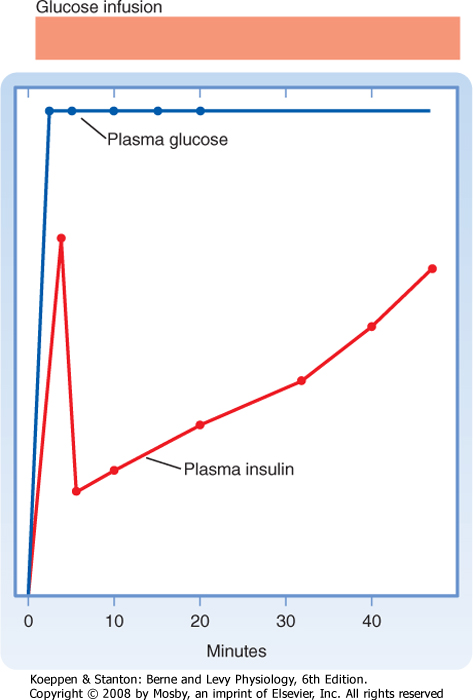
| When insulin secretion is stimulated, insulin is released within minutes. If the stimulus is maintained, insulin secretion falls within 10 minutes and then slowly rises over a period of about 1 hour (Fig. 38-13). The latter phase is referred to as the late phase of insulin release. The early phase of insulin release probably involves the release of preformed insulin, whereas the late phase represents the release of newly formed insulin.
|
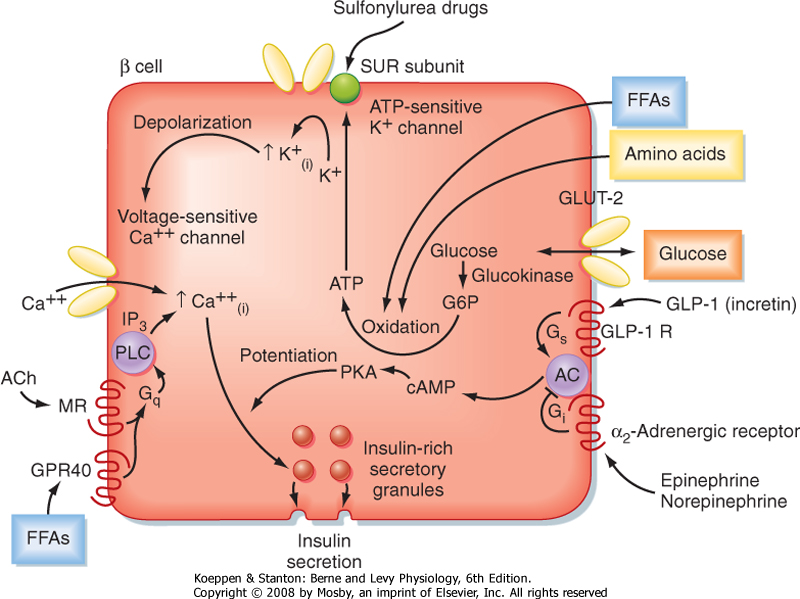
| Glucose is the primary stimulus of insulin secretion. Entry of glucose into beta cells is facilitated by the GLUT2 transporter. Once glucose enters the beta cell, it is phosphorylated to G6P by the low-affinity hexokinase glucokinase. Glucokinase is referred to as the "glucose sensor" of the beta cell because the rate of glucose entry is correlated to the rate of glucose phosphorylation, which in turn is directly related to insulin secretion. Metabolism of G6P by beta cells increases the intracellular ATP/ADP ratio and closes an ATP-sensitive K+ channel (Fig. 38-14). This results in depolarization of the beta cell membrane, which opens voltage-gated Ca++ channels. Increased intracellular [Ca++] activates microtubule-mediated exocytosis of insulin/proinsulin-containing secretory granules. The ATP-sensitive K+ channel is a protein complex that contains an ATP-binding subunit called SUR. This subunit is also activated by sulfonylurea drugs, which are widely used as oral agents to treat hyperglycemia in patients with partially impaired beta cell function.
|
|
| Figure 38-13 The insulin response to glucose infusion shows a rapid first phase of insulin release followed by a fall and a later, slower second phase. |
| Figure 38-14 Regulation of insulin secretion by the energy substrates glucose (primary secretagogue), AAs, and FFAs and by the neurotransmitters and hormones acetylcholine (ACh), norepinephrine, epinephrine, and glucagon-like peptide-1 (GLP-1). (Modified from Porterfield SP, White BA: Endocrine Physiology, 3rd ed. Philadelphia, Mosby, 2007.) |
| page 678 | | | page 679 |
| Several AAs and vagal (parasympathetic) cholinergic innervation (i.e., in response to a meal) also stimulate insulin through increasing intracellular [Ca++] (Fig. 38-14). In addition, long-chain FFAs increase insulin secretion, though to a lesser extent than glucose and AAs. FFAs may act through a G protein-coupled receptor (GPR40) on the beta cell membrane or as a nutrient that increases ATP through oxidation (Fig. 38-14).
|
| Nutrient-dependent stimulation of insulin release is enhanced by the incretin hormones glucagon-like peptide-1 (GLP-1) and gastric inhibitory polypeptide (GIP) and possibly by other gastrointestinal hormones. These hormones act primarily by raising intracellular cAMP, which amplifies the intracellular effects of Ca++ on glucose (Fig. 38-14). However, these agents do not increase insulin secretion in the absence of glucose.
|
| Insulin secretion is inhibited by α2-adrenergic receptors, which are activated by epinephrine (from the adrenal medulla) and norepinephrine (from postganglionic sympathetic fibers). α2-Adrenergic receptors act by decreasing cAMP and possibly by closing Ca++ channels (Fig. 38-14). Adrenergic inhibition of insulin serves to protect against hypoglycemia, especially during exercise. Although somatostatin from D cells inhibits both insulin and glucagon, its physiological role in pancreatic islet function in humans is unclear.
|
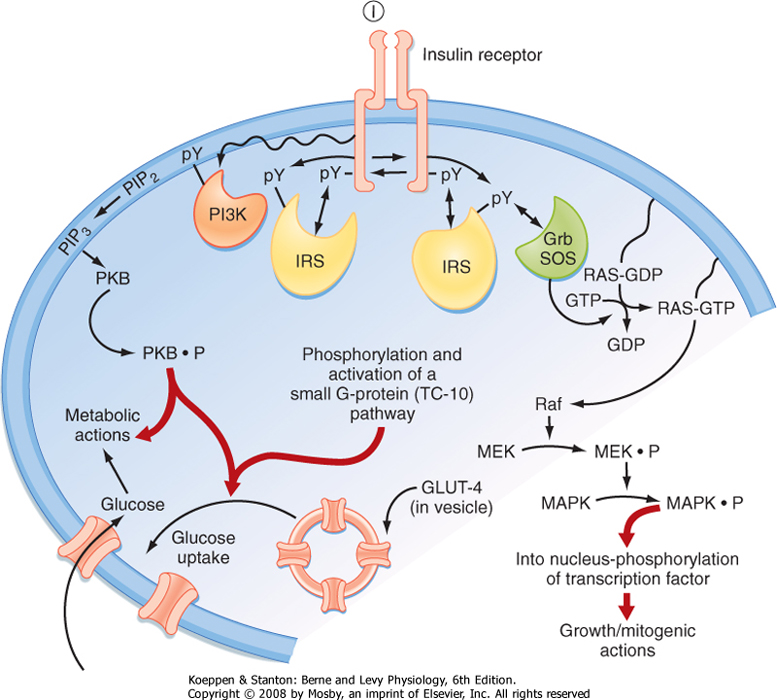
| Figure 38-15 Intracellular signaling pathways coupled to the insulin receptor. Grb2, adapter protein that links the SH2 domain on tyrosine kinase receptors to the SH3 domain of SOS, which is a Ras guanosine nucleotide exchange factor; GLUT4, glucose transporter 4; I, insulin; IRS, insulin receptor substrate; MAPK, mitogen-activated protein kinase; MEK, MAPK kinase; PI3K, phosphoinositide-3-kinase; PKB, protein kinase B (also called Akt); PIP2, phosphatidylinositol 4,5-bisphosphate; PIP3, phosphatidylinositol 3,4,5-trisphosphate; pY, phosphorylated tyrosine residue; Raf, MAPK kinase kinase. (Modified from Porterfield SP, White BA: Endocrine Physiology, 3rd ed. Philadelphia, Mosby, 2007.) |
| Insulin gene expression and islet cell biogenesis are dependent on several transcription factors that are specific to the pancreas, liver, and kidney. These transcription factors include hepatocyte nuclear factor-4α (HNF-4α), HNF-1α, insulin promoter factor-1 (IPF-1), HNF-1α, and neurogenic differentiation 1/beta cell E-box trans-activator 2 (NeuroD1/α2). Heterozygous mutation of one of these factors results in progressively inadequate production of insulin and maturity-onset diabetes of the young (MODY) before the age of 25. MODY is characterized by nonketotic hyperglycemia, often asymptomatic, that begins in childhood or adolescence. In addition to the five transcription factors, mutations in glucokinase give rise to MODY. |
| page 679 | | | page 680 |
| The insulin receptor (IR) is a member of the receptor tyrosine kinase (RTK) family (see Chapter 3). The IR is expressed on the cell membrane as a homodimer composed of α/β monomers (Fig. 38-15). The α/β
monomer is synthesized as one protein, which is then proteolytically cleaved, with the two fragments connected by a disulfide bond. The two α/β monomers are also held together by a disulfide bond between the α subunits. The α subunits are external to the cell membrane and contain the hormone binding sites. The β subunits span the membrane and contain tyrosine kinase on the cytosolic surface. Binding of insulin to the receptor induces the β subunits to cross-phosphorylate each other on three tyrosine residues. These phosphotyrosine residues recruit three classes of adapter proteins: insulin receptor substrates (IRSs),
Shc protein, and APS protein. The IRS proteins are phosphorylated, and phosphoinositide-3-kinase (PI3K) is then recruited to the membrane, where it phosphorylates its substrates and activates a pleiotropic protein kinase B (PKB)-dependent pathway that is largely involved in the metabolic effects of insulin. One important effect of insulin is to induce insertion of the glucose transporter GLUT4 into the cell membranes of muscle and adipose tissue (see later). This action requires both IRS/PI3K-dependent signaling and an additional APS adapter protein-dependent pathway that activates a small GTPase pathway. The Shc protein is linked to the mitogen-activated protein kinase (MAPK) pathway, which mediates the growth and mitogenic actions of insulin.
|
| The termination of insulin/IR signaling is a topic of interest because these mechanisms potentially play a role in IR and type 2 diabetes mellitus (T2DM). Insulin induces the down-regulation of its own receptor by receptor-mediated endocytosis and degradative pathways. Additionally, there are several serine/threonine protein kinases that are activated by insulin and that subsequently inactivate IR and IRS proteins. A third mechanism appears to involve activation of the "suppressor of cytokine signaling" (SOCS) family of proteins, which reduces the activity or levels (or both) of the IR and IRS proteins.
|
| Glucagon is the primary "counterregulatory" hormone that increases blood glucose levels through its effects on liver glucose output. Glucagon promotes the production of glucose through elevated glycogenolysis and gluconeogenesis and through decreased glycolysis and glycogenolysis. Glucagon also inhibits the synthesis of hepatic lipid from glucose.
|
| Structure, Synthesis, and Secretion
|
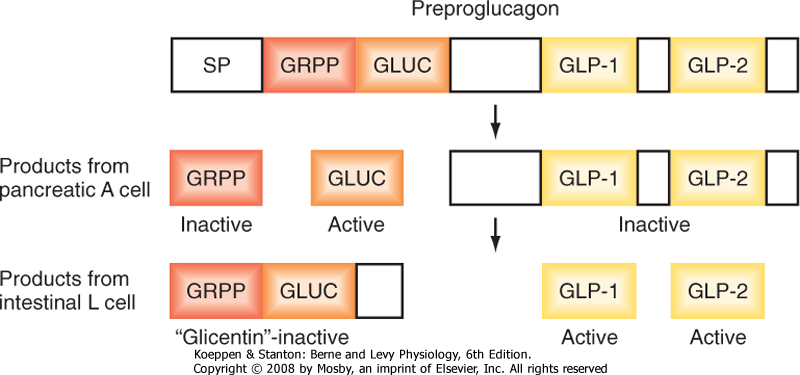
| Figure 38-16 Cell-specific processing of preproglucagon. GLUC, glucagon; GLP, glucagon-like peptide; GRPP, glicentin-related polypeptide. (Modified from Porterfield SP, White BA: Endocrine Physiology, 3rd ed. Philadelphia, Mosby, 2007.) |
| Glucagon is a member of the secretin gene family. The precursor preproglucagon harbors the AA sequences for glucagon, GLP-1, and GLP-2 (Fig. 38-16). Preproglucagon is proteolytically cleaved in the alpha cell in a cell-specific manner to produce the 29-amino acid peptide glucagon. Glucagon circulates in an unbound form and has a short half-life of about 6 minutes. The predominant site of glucagon degradation is the liver, which degrades as much as 80% of the circulating glucagon in one pass. Because glucagon (either from the pancreas or from the gut) enters the hepatic portal
vein and is carried to the liver before reaching the systemic circulation, a large portion of the hormone never reaches the systemic circulation. The liver is the primary target organ of glucagon, with only small effects on peripheral tissues.
|
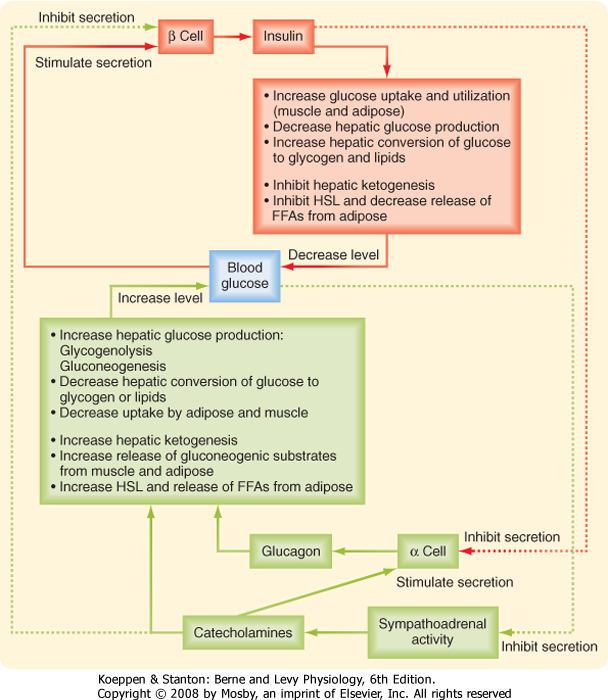
| Several factors that stimulate insulin inhibit glucagon. Indeed, it is the insulin-glucagon ratio that determines the net flow of hepatic metabolic pathways. A major stimulus for secretion of glucagon is a drop in blood glucose, which is primarily an indirect effect of the removal of inhibition by insulin (Fig. 38-17). Circulating catecholamines, which inhibit the secretion of insulin via α2-adrenergic receptors, stimulate the secretion of glucagon via β2-adrenergic receptors (Fig. 38-17). Serum AAs promote the secretion of glucagon. This means that a protein meal will increase postprandial levels of both insulin and glucagon, which protects against hypoglycemia, whereas a carbohydrate meal stimulates only insulin.
|
| Epinephrine and Norepinephrine
|
| The other major counterregulatory factors are the catecholamines epinephrine and norepinephrine. Epinephrine and norepinephrine are secreted by the adrenal medulla (see Chapter 42), whereas only norepinephrine is released from postganglionic sympathetic nerve endings. The direct metabolic actions of catecholamines are mediated primarily by β-adrenergic receptors located on muscle, adipose, and liver tissue (Fig. 38-17). Like the glucagon receptor, β-adrenergic receptors (β2 and β3) increase intracellular cAMP. Catecholamines are released from sympathetic nerve endings and the adrenal medulla in response to decreased glucose concentrations, stress, and exercise. Decreased glucose levels (i.e., hypoglycemia) are primarily sensed by hypothalamic neurons, which initiate a sympathetic response to release catecholamines.
|
| METABOLIC HOMEOSTASIS: THE INTEGRATED OUTCOME OF HORMONAL AND SUBSTRATE/PRODUCT REGULATION OF METABOLIC PATHWAYS
|
| page 680 | | | page 681 |
| Figure 38-17 Feedback loops between blood glucose and insulin, glucagon, and sympathoadrenal catecholamines. |
| Levels of blood glucose must be maintained within a specific range and are determined by the absorption
of food and the flow of recently absorbed or stored energy substrates through different metabolic pathways, which must also meet the energy demands of all cells. The relative flow of carbon through different pathways is determined by key enzymatic reactions. The enzymes involved are regulated by substrate and product concentrations and by endocrine and autonomic regulation of enzyme gene expression or activity, or both. The hormonal regulation of these key enzymatic steps will be emphasized in this section.
|
| Fasting-to-Fed State Transition Involving Anabolic Pathways That Store Energy
|
| Insulin and the Storage of Glucose as Glycogen and Triglycerides in the Liver
|
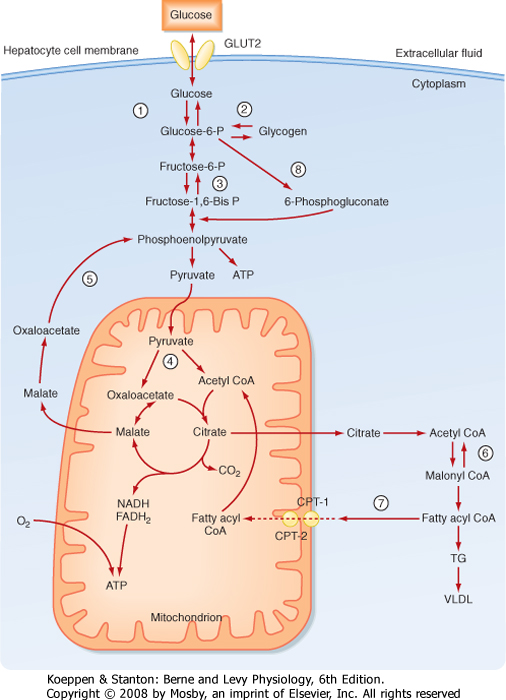
| Ingestion of a mixed meal stimulates beta cells to release insulin, and insulin rapidly inhibits release of glucagon from the adjacent alpha cells (Fig. 38-17). This results in an increased insulin-glucagon ratio in the hepatic portal vein as it enters the liver. The liver responds to this signal by increasing hepatic glucose utilization-first through enhanced glycogen synthesis. Once hepatic glycogen stores (80 to 100 g) are replenished, excess glucose is used for the synthesis of TG (the liver meets its own energy needs primarily from the oxidation of unbranched AAs in the fed state). Glucose is directed into glycolysis, which in the liver can be thought of as an accessory pathway for the synthesis of TG. Glycolysis promotes the accumulation of citrate, which serves to transport the acetyl group of acetyl CoA into the cytoplasm, where fatty acyl CoA synthesis is performed. Glucose is also directed into the nonoxidative pathway, the hexose monophosphate shunt, which is a major supplier of the NADPH required for fatty acyl CoA synthesis. In addition to these glucose-utilizing, anabolic pathways of glycogen synthesis and lipogenesis, the high insulin-glucagon ratio inhibits the hepatic glucose-producing pathways of glycogenolysis and gluconeogenesis and inhibits hepatic fatty acyl CoA oxidation. This is achieved by the stimulation of key enzymes and the concomitant inhibition of opposing enzymes. This coordinated process of activation and repression minimizes the generation of futile cycles.
|
| page 681 | | | page 682 |
| page 682 | | | page 683 |
Some of the key metabolic steps that are regulated by insulin in the liver are as follows:
- Trapping intracellular glucose (step 1; Fig. 38-18). Although glucose enters hepatocytes through insulin-independent GLUT2 transporters, insulin increases hepatic retention and utilization of glucose by increasing the expression of glucokinase. Insulin increases glucokinase gene expression through increased expression and activation of the transcription factor sterol regulatory element-binding protein-1C (SREBP-1C), which acts as a "master switch" in the fed state to coordinately increase levels of several enzymes involved in glucose utilization and TG synthesis. Insulin prevents the futile cycle of glucose phosphorylation-dephosphorylation by repressing gene expression of the enzyme G6Pase.
- Increasing glycogen synthesis (step 2; Fig. 38-18). Insulin indirectly increases glycogen synthase through increased expression of glucokinase because high levels of G6P allosterically increase glycogen synthase activity. Insulin promotes the dephosphorylation and thereby the activation of glycogen synthase. Insulin also prevents the futile cycle of glycogen synthesis ↔ glycogenolysis through inhibition of glycogen phosphorylase.
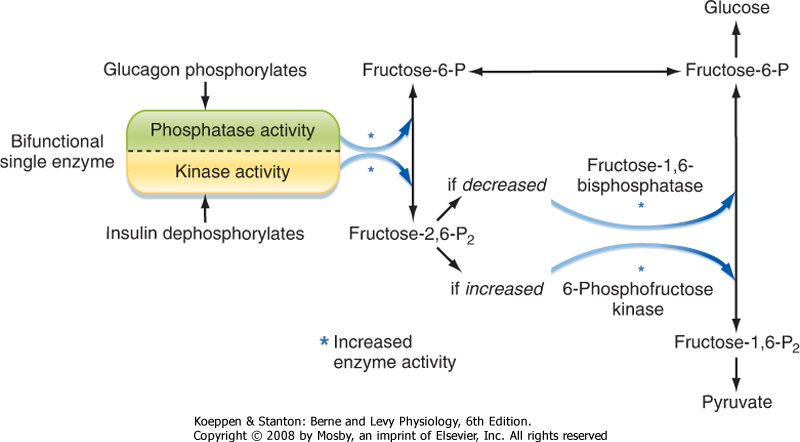
- Increasing glycolysis. Insulin increases the activity of the rate-limiting and irreversible reaction of phosphorylating F6P to fructose-1,6-bisphosphate, which is catalyzed by the enzyme phosphofructokinase-1 (PFK-1) (step 3; Fig. 38-18). Insulin promotes dephosphorylation of the bifunctional enzyme phosphofructokinase-2/fructose bisphosphatase, thereby activating the kinase function and lessening the phosphatase function (Fig. 38-19). This results in increased levels of fructose-2,6-bisphosphate,
which is an allosteric activator of PFK-1. Fructose-2,6-bisphosphatase also competitively inhibits the gluconeogenic enzyme fructose-1,6-bisphosphatase, thereby blocking the futile cycle of F6P ↔ fructose-1,6-bisphosphate. In addition, fructose-1,6-bisphosphate activates the downstream irreversible reaction of converting phosphoenolpyruvate to pyruvate, which is catalyzed by pyruvate kinase (steps 4 and 5; Fig. 38-18). Thus, insulin activates pyruvate kinase indirectly through a feed-forward mechanism that is initiated by dephosphorylation of phosphofructokinase-2/fructose bisphosphatase. Insulin also promotes the dephosphorylation of pyruvate kinase, thereby increasing the activity of the enzyme. Insulin increases pyruvate dehydrogenase activity, which converts pyruvate to acetyl CoA, an important building block for fatty acid synthesis. Insulin represses gene expression of the gluconeogenic enzyme PEPCK, which converts pyruvate, by way of oxaloacetate-malate-oxaloacetate transfer out of the mitochondria, to phosphoenolpyruvate. By repressing PEPCK, insulin blocks the futile cycle of pyruvate ↔ phosphoenolpyruvate.
- Increasing synthesis of TG (steps 6-8; Fig. 38-18). In the presence of excess amounts of glucose and AAs, the excess acetyl CoA is not used for ATP synthesis by the liver. Instead, acetyl CoA is transferred from the mitochondria to the cytosol in the form of citrate, which is then converted back to acetyl CoA and oxaloacetate by the cytosolic enzyme ATP-citrate lyase. Insulin increases ATP-citrate lyase gene expression through the transcription factor SREBP-1C. Once in the cytoplasm, acetyl CoA can enter fatty acid synthesis. The first step involves the conversion of acetyl CoA to malonyl CoA by the enzyme acetyl-CoA carboxylase. Insulin stimulates acetyl-CoA carboxylase gene expression through the transcription factor SREBP-1C. Insulin also promotes the dephosphorylation of acetyl-CoA carboxylase, which activates the enzyme. Finally, by promoting pathways (especially glycolysis) that generate high levels of citrate, insulin increases acetyl-CoA carboxylase activity indirectly through allosteric activation by citrate.
|
|
| Figure 38-18 Key hormonally regulated steps in glucose metabolism by the liver. See text for details on individual reactions. (Modified from Porterfield SP, White BA: Endocrine Physiology, 3rd ed. Philadelphia, Mosby, 2007.) |
| Figure 38-19 Regulation of the relative rates of gluconeogenesis and glycolysis by the actions of islet hormones on a single bifunctional enzyme. Insulin causes dephosphorylation of the enzyme, thus making it a kinase, which raises the level of fructose-2,6-bisphosphate. This intermediate stimulates the activity of 6-phosphofructose kinase and shifts metabolism toward pyruvate (glycolysis). Phosphorylation of the bifunctional enzyme by glucagon makes it a phosphatase, which lowers the level of fructose-2,6-bisphosphate and thereby increases the activity of fructose-1,6-bisphosphatase and shifts metabolism toward glucose (gluconeogenesis). |
| Malonyl CoA is converted to the 16-carbon fatty acid palmitate by repetitive additions of acetyl groups (contributed by malonyl CoA) by the fatty acid synthase (FAS) complex. FAS gene expression is enhanced by insulin through the transcription factor SREBP-1C. Palmitate synthesis also requires NADPH. A major source of NADPH is the pentose phosphate shunt. The first reaction of this pathway converts G6P to 6-phosphogluconolactone by the enzyme G6P dehydrogenase (G6PD) and generates NADPH. Insulin increases G6PD gene expression through the transcription factor SREBP-1C. Insulin also stimulates palmitoyl-CoA desaturase, which produces unsaturated fatty acids.
|
| By activating steps that lead to the generation of malonyl CoA, insulin indirectly inhibits the oxidation of FFAs. Malonyl CoA inhibits CPT-I activity. As a result, FFAs that are synthesized cannot be transported into mitochondria, where they undergo β oxidation. Thus, increased malonyl CoA prevents the futile cycle of FFA synthesis to FFA oxidation.
|
| page 683 | | | page 684 |
| SREBP-2 was discovered as a transcription factor that resides in the membrane of the endoplasmic reticulum (ER). In the presence of high intracellular cholesterol, SREBP-2 is held in the ER by a lipid-sensing protein called SCAP (SREBP cleavage-activating protein). In response to depleted sterols, SCAP escorts SREBP-2 to the Golgi, where SREBP is cleaved sequentially by proteases and released into the cytoplasm. SREBP-2 then translocates to the nucleus and increases the transcription of genes involved in synthesis and uptake of cholesterol. A more recently discovered member of this transcription factor family is SREBP-1C, which is highly expressed in adipose and liver. In contrast to SREBP-2, SREBP-1C stimulates genes involved in the synthesis of fatty acid and TG. Regulation of SREBP-1C occurs at the transcriptional level of the SREBP-1C gene, with cleavage induced by polyunsaturated fatty acids and activation by the MAPK pathway. |
| Peroxisome proliferation activator receptors (PPARs) belong to the nuclear hormone receptor superfamily that also includes steroid hormone receptors and thyroid hormone receptors. PPARs heterodimerize with the retinoid X receptors (RXRs). Unlike steroid and thyroid hormone receptors, PPARs bind to ligands in the micromolar range (i.e., with lower affinity). PPARs bind saturated and unsaturated fatty acids, as well as natural and synthetic prostanoids. PPARγ is highly expressed in adipose tissue and at a lower level in skeletal muscle and liver. Its natural ligands include several polyunsaturated fatty acids. PPARγ regulates genes that promote the storage of fat. It also synergizes with SREBP-1C to promote differentiation of adipocytes from preadipocytes. Tissue-specific knockout of PPARγ in mice and PPARγ dominant negative mutations in humans give rise to lipodystrophy (i.e., lack of white adipose tissue), which leads to deposits of TG in muscle and liver (called steatosis), insulin resistance, diabetes, and hypertension. The thiazolidinediones are exogenous ligands for PPARγ. Although they promote weight gain, moderate levels of thiazolidinediones significantly improve insulin sensitivity. PPARγ also stimulates secretion of adiponectin, which promotes the oxidation of lipids in muscle and fat and thereby improves insulin sensitivity. PPARα is abundantly expressed in liver and to a lesser extent in skeletal and cardiac muscle and kidney. PPARα promotes the uptake and oxidation of FFAs. Thus, PPARα is an antisteatotic molecule. The fibrates are exogenous ligands of PPARα and are used to reduce TG deposits in muscle and liver, thereby improving insulin sensitivity. A third member, PPARδ, similarly promotes fatty acid oxidation in adipose and muscle tissue. PPARδ promotes the development of slow-twitch, oxidative muscle fibers and increases muscle stamina. PPARδ has a positive effect on lipoprotein metabolism by increasing the production of apo A apoproteins and the number of HDL particles. |
| Another family of lipid-sensing transcription factors is the liver X receptor (LXR) family, which is composed of LXRα and LXRβ. LXRα is expressed primarily in adipose tissue, liver, intestine, and kidney, whereas LXRβ is ubiquitously expressed. LXRs are related to PPARs in that they are members of the nuclear hormone receptor family and heterodimerize with RXR. LXRs are cholesterol sensors. In high-cholesterol conditions, LXRs up-regulate the expression of ATP-binding cassette (ABC) proteins. In the face of excess cholesterol, LXRs also increase ABC protein expression in the gastrointestinal tract, which promotes the efflux of cholesterol from enterocytes to the lumen for excretion. Mutations in these transporters (ABCG5 and ABCG8) cause sitosterolemia, characterized by excessive absorption of cholesterol and plant sterols. In the liver, LXRs promote the conversion of cholesterol to bile acids for excretion or to cholesterol esters for storage. In the latter action, LXRs increase SREBP-1C expression, thereby increasing the fatty acyl CoAs needed for esterification. |
|
| FFAs are converted to TGs by the liver and are either stored in the liver or transported to adipose tissue and muscle in the form of VLDL. Synthesis of TG requires the presence of G3P. In the liver, G3P is
derived from insulin-enhanced glycolysis or from the phosphorylation of glycerol by the enzyme glycerol kinase. Insulin acutely promotes degradation of the VLDL apoprotein apo B-100. This keeps the liver from secreting VLDL during a meal, when the blood is rich with chylomicrons. Thus, the lipid made in response to insulin during a meal is released as VLDL during the interdigestive period and provides an important source of energy to skeletal and cardiac muscle.
|
| Insulin and Utilization of Glucose by Skeletal Muscle and Adipose Tissue
|
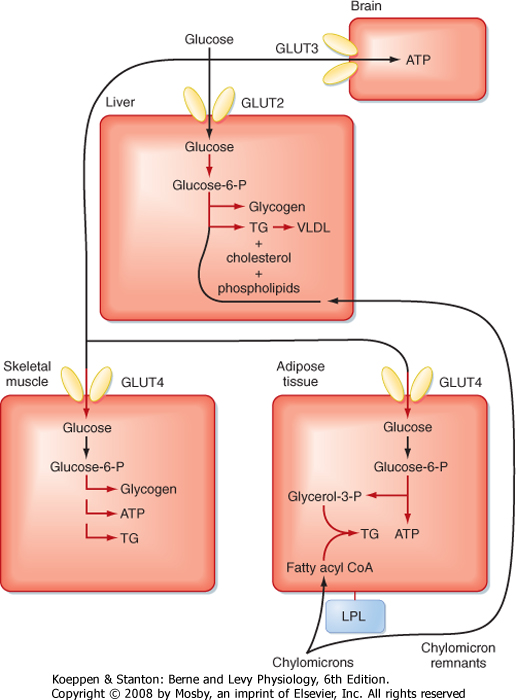
| The glucose that is not captured by the liver contributes to the postprandial rise in glucose levels in the peripheral circulation (Fig. 38-20). Glucose tolerance refers to the ability of an individual to minimize the increase in blood glucose concentration after a meal. A primary way by which insulin promotes glucose tolerance is activation of glucose transporters in skeletal muscle. Insulin stimulates the translocation of preexisting GLUT4 transporters to the cell membrane and promotes the storage of glucose in muscle by stimulating synthesis of glycogen. However, the relative amount of glucose used for replenishing glycogen stores versus the amount used for energy is dependent on the amount of physical activity that an individual is engaged in during or soon after a meal.
|
| Insulin also stimulates GLUT4-dependent uptake of glucose and subsequent glycolysis in adipose tissue (Fig. 38-20). Adipose tissue utilizes glycolysis for energy needs, but also for the generation of G3P, which is required for the reesterification of FFAs into TGs. As in the liver and skeletal muscle, excessive intake of carbohydrate can also lead to insulin-stimulated lipogenesis in adipose tissue.
|
| page 684 | | | page 685 |
| Figure 38-20 Partitioning of glucose and TG during the digestive period (high insulin-glucagon ratio). Highlighted pathways are stimulated by insulin. |
| Insulin and Storage of Ingested Lipids in Adipose Tissue
|
| Insulin stimulates the expression of LPL within adipose cells and its migration to the apical side of endothelia in adipose capillaries (Fig. 38-20). This action of insulin promotes the release of FFAs from chylomicrons within adipose tissue. Insulin also stimulates the translocation of fatty acid transport proteins into the cell membrane that facilitate the movement of FFAs into adipocytes and the activation of FFAs by their conversion to fatty acyl CoAs. Insulin stimulates glycolysis in adipocytes, which generates the G3P required for reesterification of FFAs into TGs. Insulin also inhibits hormone-sensitive lipase.
|
| Insulin and Protein Synthesis
|
| Insulin promotes protein synthesis in muscle and adipose tissue by stimulating AA uptake and mRNA translation. Insulin also inhibits proteolysis. Although the liver utilizes AAs for the synthesis of ATP, insulin also promotes the synthesis of proteins during the digestive period and attenuates the activity of urea cycle enzymes in the liver.
|
| page 685 | | | page 686 |
| Diabetes mellitus is a disease in which insulin levels or responsiveness of tissues to insulin (or both) is insufficient to maintain normal levels of plasma glucose. Although the diagnosis of diabetes is based primarily on plasma glucose, diabetes also promotes imbalances in the circulating levels of lipids and lipoproteins (i.e., dyslipidemia). With normal fasting (i.e., no caloric intake for at least 8 hours), plasma glucose levels should be below 110 mg/dL. A patient is considered to have impaired glucose control if fasting plasma glucose levels are between 110 and 126 mg/dL, and the diagnosis of diabetes is made if fasting plasma glucose exceeds 126 mg/dL on 2 successive days. Another approach to the diagnosis of diabetes is the oral glucose tolerance test. After overnight fasting, the patient is given a bolus of glucose (usually 75 g) orally, and blood glucose levels are measured at 2 hours. A 2-hour plasma glucose concentration greater than 200 mg/dL on 2 consecutive days is sufficient to make the diagnosis of diabetes.
The diagnosis of diabetes is also indicated if the patient has symptoms associated with diabetes and has a nonfasting plasma glucose level greater than 200 mg/dL. |
| Diabetes mellitus is currently classified as type 1 (T1DM) or type 2 (T2DM). T2DM is by far the more common form and accounts for 90% of diagnosed cases. However, T2DM is usually a progressive disease that remains undiagnosed in a significant percentage of patients for several years. T2DM is often associated with visceral obesity and lack of exercise-indeed, obesity-related T2DM is reaching epidemic proportions worldwide. Usually, there are multiple causes for the development of T2DM in a given individual that are associated with defects in the ability of target organs to respond to insulin (i.e., insulin resistance), along with some degree of beta cell deficiency. Insulin sensitivity can be compromised at the level of the insulin receptor (IR) or at the level of postreceptor signaling. T2DM appears to be the consequence of insulin resistance, followed by reactive hyperinsulinemia, but ultimately by relative hypoinsulinemia (i.e., inadequate release of insulin to compensate for the end-organ resistance; Fig. 38-21) and beta cell failure. |
The underlying causes of insulin resistance differ among patients. Three major underlying causes of obesity-induced insulin resistance are as follows:
- Decreased ability of insulin to increase GLUT4-mediated uptake of glucose, especially by skeletal muscle. This function, which is specifically a part of the glucometabolic regulation by insulin, may be due to excessive accumulation of TG in muscle in obese individuals. Excessive caloric intake induces hyperinsulinemia. Initially, this leads to excessive glucose uptake into skeletal muscle. Just as in the liver, excessive calories in the form of glucose promote lipogenesis and, through the generation of malonyl CoA, repression of fatty acyl CoA oxidation. Byproducts of fatty acid and TG synthesis, such as diacylglycerol and ceramide, may accumulate and stimulate signaling pathways (e.g., protein kinase C-dependent pathways) that antagonize signaling from the IR or IRS proteins, or both. Thus, insulin resistance in the skeletal muscle of obese individuals may be due to lipotoxicity.
- Decreased ability of insulin to repress hepatic glucose production. The liver makes glucose by glycogenolysis in the short term and by gluconeogenesis in the long term. The ability of insulin to repress key hepatic enzymes in both these pathways (Fig. 38-18) is attenuated in insulin-resistant individuals. Insulin resistance in the liver may also be due to lipotoxicity in obese individuals (e.g., fatty liver or hepatic steatosis). Visceral adipose tissue is likely to affect insulin signaling at the liver in several ways, in addition to the effects of lipotoxicity. For example, visceral adipose tissue releases the cytokine tumor necrosis factor-α (TNF-α), which has been shown to antagonize insulin signaling pathways. Also, TG in visceral adipose tissue has a high rate of turnover (possibly because of rich sympathetic innervation), so the liver is exposed to high levels of FFAs, which further exacerbates hepatic lipotoxicity.
- Inability of insulin to repress hormone-sensitive lipase or increase LPL in adipose tissue (or both). High HSL and low LPL are major factors in the dyslipidemia associated with insulin resistance and diabetes. Although the factors that resist the actions of insulin on HSL and LPL are not completely understood, there is evidence for the increased production of paracrine diabetogenic factors in adipose tissue, such as TNF-α. The dyslipidemia is characterized as hypertriglyceridemia with large TG-rich VLDL particles produced by the liver. Because of their high TG content, large VLDLs and IDLs are digested very efficiently, thereby giving rise to small dense LDL particles, which are very atherogenic. In addition, HDL takes on excess TG in exchange for cholesterol esters, which appears to shorten the circulating half-life of HDL and apo A proteins. Thus, there are lower levels of HDL particles, which normally play a protective role against vascular disease.
|
| Type 1 diabetes mellitus is characterized by the destruction, almost always by an autoimmune mechanism, of beta cells. T1DM is also termed "insulin-dependent diabetes mellitus." |
Characteristics of T1DM include the following:
- People with T1DM need exogenous insulin to maintain life and prevent ketosis; virtually no pancreatic insulin is produced.
- There is pathological damage to the pancreatic beta cells. Insulinitis with pancreatic mononuclear cell infiltration is a characteristic feature at the onset of the disorder. Cytokines may be involved in the early destruction of the pancreas.
- People with T1DM are prone to ketosis.
- Ninety percent of cases begin in childhood, mostly between 10 and 14 years of age. This common observation led to application of the term "juvenile diabetes" to the disorder. This term is no longer used because T1DM can arise at any time of life, although juvenile onset is the typical pattern.
- Islet cell autoantibodies are frequently present around the time of onset. If T1DM is induced by a virus, the autoantibodies are transient. Occasionally, antibodies will persist long-term, particularly if they are associated with other autoimmune disorders.
|
| About 50% of T1DM is related to problems with the major histocompatibility complex on chromosome 6. It is correlated with an increased frequency of certain human leukocyte antigen (HLA) alleles. The HLA types DR3 and DR4 are most commonly associated with diabetes. |
| page 686 | | | page 687 |
| Figure 38-21 Twenty-four-hour profiles of plasma glucose, C peptide, and insulin in normal-weight (blue lines) and obese (red lines) humans. Note the parallel increases with each meal, the rapid return toward baseline, and the exaggerated beta cell responses in obesity. (Data from Polonsky K et al: J Clin Invest 81:442, 1988.) |
| page 687 | | | page 688 |
| RELEASE OF ENERGY DURING THE INTERDIGESTIVE PERIOD OR AN EXTENDED FAST
|
| The Liver and a High Glucagon-Insulin Ratio during a Fast
|
Nutrient levels in blood fall several hours after a meal, thereby leading to lower levels of insulin secretion. Consequently, the stimulatory and inhibitory effects of insulin on hepatic, muscle, and adipose tissue are attenuated. The decrease in insulin also relieves the inhibition of glucagon secretion. Thus, the liver is exposed to an increasingly larger glucagon-insulin ratio during the interdigestive period and fasting, which has the following effects on hepatic metabolism:
- Glycogen phosphorylase is activated through protein kinase A (PKA) and phosphorylase kinase (step 2, Fig. 38-18). Conversely, glycogen synthase is inhibited through phosphorylation. Thus, glycogenolysis exceeds glycogen synthesis and supports hepatic glucose output for about 12 hours at the beginning of a fast.
- Gluconeogenic enzymes are increased over glycolytic enzymes (steps 1, 3, 4, 5; Fig. 38-18). Glucagon increases PEPCK at a transcriptional level while inhibiting pyruvate kinase by phosphorylation. The increased glucagon-insulin ratio also increases fructose-1,6-bisphosphatase and G6Pase while inhibiting the opposing enzymes phosphofructokinase-1 and glucokinase, respectively. Gluconeogenesis takes over after glycogenolysis as the primary pathway of hepatic glucose production and continues to support blood glucose levels for days during an extended fast.
- Lipogenesis is inhibited, in part, by the phosphorylation-dependent inhibition of acetyl-CoA carboxylase and activation of the opposing enzyme malonyl-CoA decarboxylase (step 6, Fig. 38-18). The reduction in malonyl CoA also relieves the inhibition on the CPT-I transporter (step 7, Fig. 38-18). This allows more efficient transport of fatty acyl CoAs into the mitochondria. The liver can then use circulating FFAs for energy, but also to synthesize ketone bodies (Fig. 38-4). Ketogenesis supplements blood glucose in that the brain can use ketone bodies after several days of a fast.
|
| As liver glycogen is depleted, the liver shifts to gluconeogenesis to maintain blood glucose levels. However, the ability of the liver to generate glucose is dependent on the ability of the liver to obtain a sufficient level of substrates (lactate, AAs, and glycerol) for gluconeogenesis. These substrates originate primarily from skeletal muscle and adipose tissue (Fig. 38-22). Most of the glucagon is inactivated by the liver, so the hormone has a small effect on adipose tissue. There are no glucagon receptors in muscle. Thus, release of gluconeogenic substrates is promoted by the lack of insulin combined with elevated levels of the catecholamines epinephrine and norepinephrine. Epinephrine and norepinephrine are released in response to chronic hypoglycemia through an autonomic mechanism that originates in the hypothalamus. Catecholamines amplify the effects of glucagon on the liver and act as the primary counterregulatory hormones (or neurotransmitter in the case of norepinephrine) at skeletal muscle and adipose tissue.
|
| In skeletal muscle, a high catecholamine-insulin ratio promotes increased proteolysis and decreased protein synthesis (Fig. 38-22). This results in the release of gluconeogenic and ketogenic AAs. Because skeletal muscle shifts to the use of FFAs for energy during a fast, pyruvate dehydrogenase is inhibited by the relatively abundant acetyl CoA generated by β oxidation. Thus, more pyruvate is converted to lactate, which is released to be used by the liver for gluconeogenesis.
|
| In adipose tissue, a high catecholamine-insulin ratio stimulates the phosphorylation of hormone-sensitive lipase and perilipin proteins that surround fat droplets. Phosphorylated perilipins dissociate from the TG-cytoplasm interface and allow access to hormone-sensitive lipase, which is activated by phosphorylation. Complete deesterification of TGs results in FFAs and glycerol (Fig. 28-22). FFAs circulate in blood as FFA-albumin complexes and are used by several tissues (including skeletal muscle, liver, and adipose tissue) for energy. This use of FFAs, especially by skeletal muscle, plays an essential "glucose-sparing" role. This means that FFAs compete for the enzymes involved in the oxidation of glucose, with the result that less glucose is consumed by muscle and other tissues. The high catecholamine-insulin ratio also minimizes the ability of skeletal muscle to take up glucose through GLUT4 transporters. Consequently, the glucose-sparing action of FFAs indirectly increases the availability of blood glucose to cell types that are obligate glucose users.
|
| After several days of fasting, circulating ketone bodies can be used by the brain (Fig. 38-22). This places less demand on the liver to maintain normal levels of glucose.
|
| In summary, during fasting, both skeletal muscle and adipose tissue contribute directly to circulating blood glucose through the release of gluconeogenic substrates (lactate, AAs, glycerol) and indirectly through the release of FFAs, which allow skeletal muscle and other tissues to consume less glucose. Finally, release of FFAs and ketogenic AAs supports ketogenesis by the liver.
|
| RELEASE OF ENERGY DURING EXERCISE
|
| page 688 | | | page 689 |
| Figure 38-22 Utilization of glucose, TG, and protein during the interdigestive period or fasting (low insulin-glucagon ratio). Highlighted steps are promoted by glucagon or epinephrine/norepinephrine, or both. |
| Figure 38-23 Energy sources during exercise. Note the sequential use of stored high-energy phosphate bonds, glycogen, circulating glucose, and circulating FFAs. The latter dominate in sustained exercise. |
| The metabolic response to exercise resembles the response to fasting in that the mobilization and generation of fuels for oxidation are dominant factors. The type and amounts of expended substrate vary with the intensity and duration of the exercise (Fig. 38-23). For very intense, short-term exercise (e.g., a 10- to 15-second sprint), stored creatine phosphate and ATP provide the energy at a rate of approximately 50 kcal/min. When these stores are depleted, additional intensive
exercise for up to 2 minutes can be sustained by breakdown of muscle glycogen to G6P, with glycolysis yielding the necessary energy (at a rate of 30 kcal/min). This anaerobic phase is not limited by depletion of muscle glycogen, but rather by the rapid accumulation of lactic acid in the exercising muscles and circulation.
|
| page 689 | | | page 690 |
| After several minutes of exhaustive anaerobic exercise, an O2 debt of 10 to 12 L can be built up. This must be repaid before the exercise can be repeated. From 6 to 8 L of O2 is required either to resynthesize the accumulated lactic acid back into glucose in the liver or to oxidize it to CO2. About 2 L of O2 is required to replenish normal muscle ATP and creatine phosphate stores.
An additional 2 L of O2 will replenish the O2 normally present in the lungs and body fluids and the O2 bound to myoglobin and hemoglobin.
|
| For less intense but longer periods of exercise, aerobic oxidation of substrates is required to produce the necessary energy (at a maximum of about 12 kcal/min). Substrates from the circulation are added to muscle glycogen (Fig. 38-23). After a few minutes, uptake of glucose from plasma increases dramatically, up to 30-fold in some muscle groups. Although resting glucose uptake by muscle is regulated by insulin and this effect increases somewhat with exercise, the major increase in glucose transport into muscle is mediated by an entirely separate insulin-independent factor. During exercise, intracellular glucose and ATP levels initially fall and AMP levels rise. AMP then markedly stimulates glucose transport by activating AMP kinase. To offset this drain on extracellular glucose and to maintain a normal plasma glucose level, hepatic glucose production must increase up to fivefold. Initially, this occurs largely from glycogenolysis. Indeed, endurance can be improved by high carbohydrate ingestion for several days before prolonged exercise (e.g., a marathon run) because this increases both liver and muscle glycogen stores. With exercise of longer duration, however, gluconeogenesis becomes increasingly important as liver glycogen stores become depleted. To support gluconeogenesis, AAs are increasingly released by muscle proteolysis, and their fractional uptake by the liver is enhanced. The activities of key gluconeogenic enzymes, such as PEPCK, are increased, and transcription of their genes is induced. These events are coordinated by increased sympathetic neural activity and by the relative effects of the glucagon-insulin ratio.
|
| Eventually, fatty acids liberated from TGs in adipose tissue form the predominant energy substrate, and they supply two thirds of the needs during sustained exercise. The increased AMP levels noted earlier activate AMP kinase, which phosphorylates and thereby greatly reduces the activity of the enzyme acetyl-CoA carboxylase. Thus, levels of malonyl CoA, the product of acetyl CoA carboxylation, fall. This releases inhibition of CPT by malonyl CoA and thereby promotes the entry of fatty acids into the mitochondria, where their oxidation provides energy for sustained muscle work. Except for increases in circulating levels of pyruvate and lactate, which result from greatly enhanced glycolysis, the pattern of change in the other plasma substrates is similar to that induced by fasting, but it occurs over a much shorter time frame. During recovery from exercise, muscle and liver glycogen stores must be rebuilt, which requires input of energy. Some energy is also needed during this period to recycle the unexpended FFA back into TGs.
|
| LEPTIN AND ADIPOSE TISSUE
|
| Several diseases that affect muscle function and exercise capacity result from genetic defects in energy-generating steps. (1) In McArdle's disease, or muscle phosphorylase deficiency, glycogen cannot be rapidly broken down to G6P, and hence pain and weakness occur even during brief exercise. The impairment in glycolysis from lack of substrate is demonstrated by failure of lactate levels to rise in a draining vein after anaerobic forearm muscle exercise with arterial inflow occluded. (2) In von Gierke's disease, or G6Pase deficiency, hepatic glucose release is impaired, and this limits the supply of glucose during the early phase of exercise. (3) Deficiencies of the β oxidation enzymes carnitine or CPT (required to transfer FFA into mitochondria) prevent efficient use of FFA. This restricts exercise capacity and produces muscle weakness and pain. Conditions (2) and (3) also lead to hypoglycemia during fasting because hepatic glucose production is decreased. |
|
| Adipose tissue is not contiguous, but spread throughout the body. There are two forms of adipose tissue, brown adipose tissue (BAT) and white adipose tissue
(WAT). BAT plays an important role in thermogenesis in the newborn, but BAT is reduced in adult humans. WAT plays three general roles. First, WAT is used for cushioning (e.g., in the orbits surrounding the eyeballs). Second, the vast majority of WAT is used as a metabolic storage depot that can be called on to release FFAs and glycerol in times of fasting. Third, the WAT involved in nutrient storage also functions as a classic endocrine organ.
|
| WAT is composed of several cell types. The TG-storing cell is called the adipocyte. These cells develop from preadipocytes during gestation in humans. This process of adipocyte differentiation, which may continue throughout life, is promoted by several transcription factors. One of these factors is sterol regulatory element-binding protein 1C. SREBP-1C regulates genes involved in FFA and TG synthesis. SREBP-1C is activated by lipids, as well as by insulin and several growth factors and cytokines. Another important transcription factor in WAT is PPARγ. Activated PPARγ promotes the expression of genes involved in TG storage. Thus, an increase in food consumption leads to activation of SREBP-1C and PPARγ, which increase the differentiation of preadipocytes into small adipocytes and the up-regulation of enzymes within these cells to allow storage of the excess fat. The thiazolidinediones are pharmacological activators of PPARγ that are used to treat insulin resistance and T2DM.
|
| Adipose tissue produces paracrine and endocrine factors, including adiponectin, TNF-α, resistin, interleukin-6, angiotensinogen, and acylation-stimulating protein. The roles of these factors in humans are uncertain, and thus they will not be considered in detail.
|
| page 690 | | | page 691 |
| Leptin is an adipocyte-derived protein that signals information to the hypothalamus about the degree of
adiposity and nutrition, which in turn controls eating behavior and energy expenditure. Leptin-deficient mice and humans become morbidly obese. These findings originally raised hope that leptin therapy could be used to combat morbid obesity. However, administration of leptin to individuals who suffer from diet-induced obesity does not have a significant anorectic or energy-consuming effect. In fact, obese individuals already have elevated endogenous circulating levels of leptin and appear to have developed leptin resistance.
|
| Leptin has an important role in liporegulation in peripheral tissues. Leptin protects peripheral tissues (e.g., the liver, skeletal muscle, cardiac muscle, beta cells) from the accumulation of too much lipid by directing storage of excess caloric intake into adipose tissue. This action of leptin, though opposing the lipogenic actions of insulin, contributes significantly to the maintenance of insulin sensitivity (as defined by insulin-dependent glucose uptake) in peripheral tissues. Leptin also acts as a signal that the body has sufficient energy stores to allow reproduction and to enhance erythropoiesis, lymphopoiesis, and myelopoiesis. For example, in women suffering from anorexia nervosa, leptin levels are extremely low and result in low ovarian steroids, amenorrhea (lack of menstrual bleeding), anemia from low red blood cell production, and immune dysfunction.
|
| Structure, Synthesis, and Secretion
|
| Leptin, a 16-kDa protein secreted by mature adipocytes, is structurally related to cytokines. Thus, it is sometimes referred to as an adipocytokine. Circulating levels of leptin have a direct relationship with adiposity and nutritional status. Leptin output is increased by insulin, which prepares the body for the correct partitioning of incoming nutrients. Leptin is inhibited by fasting and weight loss and by lipolytic signals (e.g., increased cAMP and β3-agonists).
|
| Diet-induced obesity, advanced age, and T2DM are associated with leptin resistance. Thus, mechanisms that turn off leptin signaling are potential therapeutic targets.
|
| The amount of energy stored by an individual is determined by caloric intake and calories expended as energy per day. In many individuals, input and output are in balance, so weight remains relatively constant. However, the abundance of inexpensive high-fat, high-carbohydrate food, along with more sedentary lifestyles, is currently contributing to a pandemic of obesity and the pathological sequelae of obesity, including T2DM and cardiovascular disease.
|
| The preponderance of stored energy consists of fat, and individuals vary greatly in the amount and percentage of body weight that is accounted for by adipose tissue. About 25% of the variance in total body fat appears to be due to genetic factors. A genetic influence on fat mass is supported by (1) the tendency for the body mass of adopted children to correlate better with that of their biological parents than with that of their adoptive parents; (2) the greater similarity of adipose stores in identical (monozygotic) twins, whether reared together or apart, than in fraternal (dizygotic) twins; (3) the greater correlation between gains in body weight and abdominal fat in identical twins than in fraternal twins when they are fed a caloric excess; and (4) the discovery of several genes that cause obesity.
|
| In addition, the gestational environment has a profound effect on body mass of the adult. The effect of maternal diet on the weight and body composition of offspring is called fetal programming. Low birth weights correlate with increased risk for obesity, cardiovascular disease, and diabetes. These findings suggest that the efficiency of fetal metabolism has plasticity and can be altered by the in utero environment. The development of a "thrifty" metabolism would be advantageous to an individual born to a mother who received poor nutrition and into a life that meant chronic undernourishment.
|
A measure of adiposity is the body mass index (BMI). The BMI of an individual is calculated as
|
| The BMI of healthy lean individuals ranges from 20 to 25. A BMI greater than 25 indicates that the individual is overweight, whereas a BMI higher than 30 indicates obesity. The condition of being overweight or obese is a risk factor for multiple pathologies, including insulin resistance, dyslipidemia, diabetes, cardiovascular disease, and hypertension.
|
| WAT tissue is divided into subcutaneous and intraabdominal (visceral) depots. Intraabdominal WAT refers primarily to omental and mesenteric fat and is the smaller of the two depots. These depots receive different blood supplies that are drained in a fundamentally different way in that venous return from intraabdominal fat leads into the hepatic portal system. Thus, intraabdominally derived FFAs are mostly cleared by the liver, whereas subcutaneous fat is the primary site for providing FFAs to muscle during exercise or fasting. The regulation of intraabdominal and subcutaneous adipose tissue also differs. Abdominal fat is highly innervated by autonomic neurons and has a greater turnover rate. Furthermore, these two depots display differences in hormone production and enzyme activity.
|
| page 691 | | | page 692 |
| Men tend to gain fat in the intraabdominal depot (android [apple-shaped] adiposity), whereas women tend to gain fat in the subcutaneous depot, particularly in the thighs and buttocks (gynecoid [pear-shaped] adiposity). Clearly, an excess of abdominal fat poses a greater risk factor for the pathologies mentioned earlier. Thus, another indicator of body composition is circumference of the waist (measured in inches around the narrowest point between the ribs and hips when viewed from the front after exhaling) divided by the circumference of the hips (measured at the point where the buttocks are largest when viewed from the side). This waist-hip ratio may be a better
indicator of body fat than BMI, especially as it relates to the risk for the development of diseases. A waist-hip ratio of greater than 0.95 in men or 0.85 in women is linked to a significantly higher risk for the development of diabetes and cardiovascular disease.
|
|
Table 38-3.
Modulators of Feeding Behavior |
| Stimulate Orexigenic Behavior | Inhibit Anorexigenic Behavior |
| Neuropeptide Y (NPY) | Leptin |
| Agouti-related peptide (AGRP) | Insulin |
| Melanin-concentrating hormone (MCH) | α-Melanocyte-stimulating hormone (α-MSH) |
| Orexin A and B (hypocretin 1 and 2) | Corticotropin-releasing hormone (CRH)
Urocortin |
| Galanin | Cocaine-amphetamine-regulated transcript (CART) |
| Norepinephrine | |
| Ghrelin | GLP-1 |
| Cortisol | Cholecystokinin (CCK) |
| | Interleukin-1β |
| | Serotonin |
| | Enterostatin |
| | Calcitonin |
| | Bombesin |
| Figure 38-24 Current concept of the effects of leptin in the brain. One target neuron transmits the proorexigenic peptide NPY and the peptide AGRP, which antagonizes the anorexigenic peptide α-MSH. Neuronal expression of these two genes is inhibited by leptin. Another target neuron transmits α-MSH, synthesized by expression of the POMC gene, and CART. This neuron's activity is stimulated by leptin. The cumulative effect of all four actions is to decrease food intake. (Modified from Schwartz MW et al: Nature 404:661, 2000.). |
| page 692 | | | page 693 |
| In recent years, numerous hormones and neuropeptides have been implicated in the chronic and acute regulation of appetite, satiety, and energy expenditure in humans (Table 38-3). One simplified model involves
two peptide hormones, leptin and insulin (Fig. 38-24). Leptin acts on at least two neuron types in the arcuate nucleus of the hypothalamus. In the first, leptin represses the production of neuropeptide Y (NPY), a very potent stimulator of food-seeking behavior (energy intake) and an inhibitor of energy expenditure. Norepinephrine, another appetite stimulator, colocalizes with NPY in some of these neurons. At the same time, leptin represses the production of agouti-related peptide (AGRP), an endogenous antagonist that acts on MC4R, a hypothalamic receptor for the anorexigenic peptide α-melanocyte-stimulating hormone (α-MSH), which inhibits food intake. In another type of arcuate neuron, leptin stimulates the production of proopiomelanocortin (POMC) products, one of which is α-MSH, and the production of cocaine-amphetamine-regulated transcript (CART), both of which inhibit food intake. Thus, leptin decreases food consumption and increases energy expenditure by simultaneously inhibiting NPY and the α-MSH antagonist AGRP and by stimulating α-MSH and CART (Fig. 38-24). These second-order neuropeptides are transmitted to and interact with receptors in neurons of the paraventricular hypothalamic nucleus ("satiety" neurons) and lateral hypothalamic nucleus ("hunger" neurons). In turn, these hypothalamic neurons generate signals that coordinate feeding behavior and autonomic
nervous system activity (especially sympathetic outflow) with diverse endocrine actions on thyroid gland function, reproduction, and growth.
|
| Another regulator of food intake and body energy stores is melanin-concentrating hormone (MCH). This neuropeptide increases food seeking and adipose tissue by antagonizing the satiety effect of α-MSH downstream from the interaction of α-MSH with its MC4R receptor. The probable importance of this molecule is demonstrated by the fact that it is the only regulator whose ablation by gene knockout actually results in leanness.
|
| To maintain overall energy homeostasis, the system must also balance specific nutrient intake and expenditure, for example, carbohydrate (CHO) intake with CHO oxidation. This may account for some specificity in neuropeptide and neurotransmitter responses to meals. Serotonin produces satiety after the ingestion of glucose. Gastrointestinal hormones such as cholecystokinin and GLP-1 (Table 38-3) produce satiety by humoral effects, but their local production in the brain may participate in nutrient and caloric regulation. The recently discovered hormone ghrelin is an acylated peptide with potent orexigenic activity that arises in cells of the oxyntic glands in the stomach. Plasma levels of ghrelin rise in humans in the 1 to 2 hours that precede their normal meals. Plasma levels of ghrelin fall drastically to minimum values about 1 hour after eating. Ghrelin appears to stimulate food intake by reacting with its receptor in hypothalamic neurons that express NPY.
|
| Hyperglycemia leads to elevated intracellular glucose and cellular toxicity, notably in endothelial cells in the retina, kidney, and capillaries associated with peripheral nerves. This glucotoxicity alters cell function in several ways that may contribute to pathological changes, including increased synthesis of polyols, hexosamines, and diacylglycerol (which activates protein kinase C). Although the exact mechanisms by which intracellular accumulation of these molecules causes abnormal cell function remain unclear, current thinking indicates that these changes lead to increased oxidative stress within the cell. Additionally, intracellular nonenzymatic glycation of proteins gives rise to advanced glycation end products (AGEs). Intracellular AGEs have altered function, whereas AGEs secreted in the extracellular matrix interact abnormally with other matrix components and matrix receptors on cells. Finally, some secreted AGEs interact with receptors on macrophages and endothelial cells. Endothelial receptors for AGEs (RAGEs) lead to proinflammatory gene expression. |
|
| page 693 | | | page 694 |
An important circulating product of glycation is hemoglobin A1c (HbA1c), which is a useful marker for long-term glucose regulation. A red blood cell has a 120-day life span; once glycation occurs, the hemoglobin remains glycated for the remainder of the red blood cell's life span. The proportion of HbA1c present in a nondiabetic person is low. However, a diabetic patient who has had prolonged periods of hyperglycemia (8 to 12 weeks) has elevated levels of HbA1c; thus measurements of HbA1c are clinically useful for determining compliance with treatment.
- Retinopathies (e.g., retinal abnormalities) frequently develop in diabetic patients. Retinopathies are the major cause of new-onset blindness in preretirement adults in the United States. Hyperglycemia results in high intracellular glucose concentrations in retinal endothelial cells and pericytes (capillary supportive cells). This is due to an inability of these cells to adapt to hyperglycemia by decreasing GLUT2 expression. Elevated intracellular glucose initiates multiple mechanisms that ultimately result in endothelial cell dysfunction and, as a result, decreased nitric oxide production, increased vascular resistance, hypertensive-induced changes, and cell death. These microvascular changes lead to microaneurysms, increased capillary permeability, small retinal hemorrhages, and excessive microvascular proliferation. Proliferative retinopathy is caused by impaired blood flow to the retina and the resultant tissue hypoxia. Subsequent vascular degeneration can produce vitreal hemorrhage, retinal detachment, and neovascular glaucoma, all of which can lead to severe visual loss.
- Peripheral nerve damage (neuropathy) can occur as a result of metabolic, oxidative, or immune-related damage to neurons or Schwann cells. Additionally, the microvasculature of peripheral nerves undergoes changes similar to those seen in retinopathy and may represent an event that is concurrent with or causal to the peripheral neuropathy. Schwann cells (supportive cells involved in myelination) are among those shown to accumulate sorbitol in response to hyperglycemia. Diabetic patients can exhibit sensory loss, paresthesias, and even pain as a result of the neurologic damage. Neuropathy of the autonomic nerves also develops in diabetics and can lead to numerous symptoms in multiple organ systems, including erectile dysfunction, postural hypotension, and heat intolerance. The sensory loss is more apparent in the extremities, particularly the lower portions of the legs and feet. This poses particular problems because as diabetic patients lose cutaneous sensation in their feet, they become unaware of poorly fitting shoes and are more prone to injuries. Poor peripheral circulation aggravates this problem. Because diabetic patients have impaired wound healing, foot ulcerations can become a serious threat.
- Diabetes is a common cause of reduced renal function (nephropathy) and is the greatest cause of end-stage renal disease in North America. Clinical or overt diabetic nephropathy is characterized by the loss of greater than 300 mg of albumin in urine over a 24-hour period (albuminuria) and a progressive decline in renal function. Nephropathies develop
from microvascular changes that occur in the glomerular capillaries. The glomerular capillary basement membrane thickens, and as a result the walls are thicker, the lumens are narrower (glomerulosclerosis), and the supportive mesangial cells are expanded. Poor renal filtration also leads to activation of the renin-angiotensin system, which induces hypertension.
- Atherosclerosis develops in diabetic patients at an accelerated rate (macroangiopathy). Diabetic patients are more likely to have coronary artery disease and myocardial infarction than nondiabetic individuals are. Many diabetics with coronary artery disease have the additional risk factors of hypertension, abdominal obesity, insulin resistance, and dyslipidemia. This cluster of factors has been identified as metabolic syndrome (also called syndrome X, insulin resistance syndrome, and cardiovascular dysmetabolic syndrome). Some of the consequences of visceral obesity, insulin resistance, and dyslipidemia have been discussed earlier.
- Nonretinal visual problems result as blood glucose and therefore blood osmolarity rise; the volume of the lens changes, thereby distorting vision. Diabetic patients commonly have cataracts, and accumulations of sorbitol and glycosylated protein have been proposed as mechanisms for inducing cataract formation.
|
|
| page 694 | | | page 695 |
- Cells make ATP to meet their energy needs. ATP is made by glycolysis and by the TCA cycle coupled to oxidative phosphorylation.
- Cells can oxidize carbohydrate (primarily in the form of glucose), AAs, and FFAs to make ATP. Additionally, the liver makes ketone bodies for other tissues to oxidize for energy in times of fasting.
- Some cell types are limited in the energy substrates that they can oxidize for energy. The brain is normally exclusively dependent on glucose for energy. Thus, blood glucose must be maintained above 60 mg/dL for normal autonomic and central nervous system function. Conversely, inappropriately high levels of glucose (i.e., fasting glucose above 110 mg/dL) promote glucotoxicity and thereby lead to the long-term complications of diabetes.
- The endocrine pancreas produces the hormones insulin, glucagon, somatostatin, gastrin, and pancreatic polypeptide.
- Insulin is an anabolic hormone that is secreted in times of excess nutrient availability. It allows the body to use carbohydrates as energy sources and store nutrients.
- Major stimuli for insulin secretion include increased serum glucose and some AAs. Activation of cholinergic (muscarinic) receptors also increases insulin secretion, whereas activation of α2-adrenergic receptors inhibits insulin secretion. The gastrointestinal tract releases incretin hormones that stimulate pancreatic insulin secretion. GLP-1 and GIP are particularly potent in augmenting glucose-dependent stimulation of insulin secretion.
- Insulin binds to the insulin receptor, which is linked to multiple pathways that mediate the metabolic and growth effects of insulin.
- During the digestive period, insulin acts on the liver to promote trapping of glucose as G6P. Insulin also increases glycogenesis, glycolysis, and fatty acid synthesis in the liver. Insulin regulates hepatic metabolism both by regulating gene expression and by posttranslational dephosphorylation events.
- Insulin increases GLUT4-mediated glucose uptake in muscle and adipose tissue. It increases glycogenesis, glycolysis, and in the presence of caloric excess, lipogenesis in muscle and adipose tissue. Insulin increases muscle AA uptake and protein synthesis. It also increases fatty acid esterification and lipoprotein lipase activity and decreases hormone-sensitive lipase activity in adipocytes.
- Glucagon is a catabolic hormone. Its secretion increases during periods of food deprivation, and it acts to mobilize nutrient reserves. It also mobilizes glycogen, fat, and even protein.
- Glucagon is released in response to decreased serum glucose (and therefore insulin) and increased serum AA levels and β-adrenergic signaling.
- Glucagon binds to the glucagon receptor, which is linked to PKA-dependent pathways. The primary target organ for glucagon is the liver. Glucagon increases liver glucose output by increasing glycogenolysis and gluconeogenesis. It increases β oxidation of fatty acids and ketogenesis.
- Glucagon regulates hepatic metabolism both by regulation of gene expression and through posttranslational PKA-dependent pathways.
- The major counterregulatory factors in muscle and adipose tissue are the adrenal hormone epinephrine and the sympathetic neurotransmitter norepinephrine. These two factors act through β2- and β3-adrenergic receptors to increase cAMP levels. Epinephrine and norepinephrine enhance glycogenolysis and fatty acyl oxidation in muscle and increase hormone-sensitive lipase in adipose tissue.
- Diabetes mellitus is classified as type 1 (T1DM) and type 2 (T2DM). T1DM is characterized by the destruction of pancreatic beta cells, and exogenous insulin is required for treatment. T2DM can be due to numerous factors but is usually characterized as insulin resistance coupled to some degree of beta cell deficiency. Patients with T2DM
may require exogenous insulin at some point to maintain blood glucose levels.
- Obesity-associated T2DM is currently at epidemic proportions worldwide and is characterized by insulin resistance because of lipotoxicity, hyperinsulinemia, and inflammatory cytokines produced by adipose tissue. T2DM is often associated with obesity, insulin resistance, hypertension, and coronary artery disease. This constellation of risk factors is referred to as the metabolic syndrome.
- Major symptoms of diabetes mellitus include hyperglycemia, polyuria, polydipsia, polyphagia, muscle wasting, electrolyte depletion, and ketoacidosis (in T1DM).
- The long-term complications of poorly controlled diabetes are due to excess intracellular glucose (glucotoxicity), especially in the retina, kidney, and peripheral nerves. This leads to retinopathy, nephropathy, and neuropathy.
- Adipose tissue has an endocrine function, especially in terms of energy homeostasis. Hormones produced by adipose tissue include leptin and adiponectin. Leptin acts on the hypothalamus to promote satiety.
|
|
|