|
|
Table of Contents |
|
17.7 Customized MPE LoggingIf you want more control over the information that MPE supplies, you can manually instrument your code. This can be done in combination with MPE default logging or independently. Here is an example of adding MPE command to rect2.c, a program you are already familiar with. The new MPE commands are in boldface. (You'll notice a few other minor differences as well if you look closely at the code.) #include "mpi.h"
#include "mpe.h"
#include <stdio.h>
/* problem parameters */
#define f(x) ((x) * (x))
#define numberRects 50
#define lowerLimit 2.0
#define upperLimit 5.0
int main( int argc, char * argv[ ] )
{
/* MPI variables */
int dest, noProcesses, processId, src, tag;
int evnt1a, evnt1b, evnt2a, evnt2b, evnt3a, evnt3b, evnt4a, evnt4b;
double start, finish;
MPI_Status status;
/* problem variables */
int i;
double area, at, height, lower, width, total, range;
/* MPI setup */
MPI_Init(&argc, &argv);
MPI_Comm_size(MPI_COMM_WORLD, &noProcesses);
MPI_Comm_rank(MPI_COMM_WORLD, &processId);
if (processId = = 0) start = MPI_Wtime( );
MPE_Init_log( );
/* Get event ID from MPE */
evnt1a = MPE_Log_get_event_number( );
evnt1b = MPE_Log_get_event_number( );
evnt2a = MPE_Log_get_event_number( );
evnt2b = MPE_Log_get_event_number( );
evnt3a = MPE_Log_get_event_number( );
evnt3b = MPE_Log_get_event_number( );
evnt4a = MPE_Log_get_event_number( );
evnt4b = MPE_Log_get_event_number( );
if (processId = = 0) {
MPE_Describe_state(evnt1a, evnt1b, "Setup", "yellow");
MPE_Describe_state(evnt2a, evnt2b, "Receive", "red");
MPE_Describe_state(evnt3a, evnt3b, "Display", "blue");
MPE_Describe_state(evnt4a, evnt4b, "Send", "green");
}
MPE_Start_log( );
MPI_Barrier(MPI_COMM_WORLD);
MPE_Log_event(evnt1a, 0, "start setup");
/* adjust problem size for subproblem*/
range = (upperLimit - lowerLimit) / noProcesses;
width = range / numberRects;
lower = lowerLimit + range * processId;
/* calculate area for subproblem */
area = 0.0;
for (i = 0; i < numberRects; i++)
{ at = lower + i * width + width / 2.0;
height = f(at);
area = area + width * height;
}
MPE_Log_event(evnt1b, 0, "end setup");
MPI_Barrier(MPI_COMM_WORLD);
/* collect information and print results */
tag = 0;
if (processId = = 0) /* if rank is 0, collect results */
{ MPE_Log_event(evnt2a, 0, "start receive");
total = area;
for (src=1; src < noProcesses; src++)
{ MPI_Recv(&area, 1, MPI_DOUBLE, src, tag, MPI_COMM_WORLD, &status);
total = total + area;
}
MPE_Log_event(evnt2b, 0, "end receive");
MPE_Log_event(evnt3a, 0, "start display");
fprintf(stderr, "The area from %f to %f is: %f\n",
lowerLimit, upperLimit, total );
}
else /* all other processes only send */
{ MPE_Log_event(evnt4a, 0, "start send");
dest = 0;
MPI_Send(&area, 1, MPI_DOUBLE, dest, tag, MPI_COMM_WORLD);
MPE_Log_event(evnt4b, 0, "end send");
}
if (processId = = 0)
{ finish = MPI_Wtime( );
printf("Elapsed time = %f\n", finish-start);
MPE_Log_event(evnt3b, 0, "end display");
}
/* finish */
MPE_Finish_log("rect2-log");
MPI_Finalize( );
return 0;
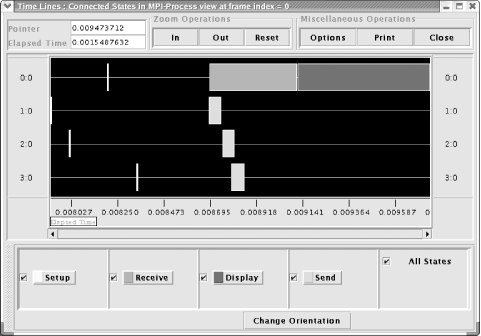
}Let's examine the changes. First, you'll notice that the mpe.h header file has been included. Next, in this example, we want to look at four sections of code, so we've added variables to record event numbers for each, evnt1a through evnt4b. We'll need a pair of variables for each block of code. Event numbers are just distinct integers used to identify events. You could make up your own as long as you are consistent, but it is better to use the MPE function MPE_Log_get_event_number, which ensures that you have unique numbers. It is essential that you use it if you are putting these commands in functions stored in a library or functions that call libraries. With each pair of event numbers, we've associated a description and color using the MPE_Describe_state function. This is used to create the legend, color the graphs, etc. Notice that one event starts a block that you want measured and a second event ends it. Make sure your events are paired and are called exactly once. You'll notice that all the other MPE function calls are bracketed between calls to MPE_Init_log and MPE_Finish_log. If you are combining your logging with MPE's default logging, i.e., linking your program to liblmpe.a, these function calls should not be included. They will be called by MPI_Init and MPI_Finish, respectively. However, if you are using the MPE function call independently-that is, without using MPE's default logging-you'll need these two calls. Note that MPE_Finish_log allows you to specify a name for the logfile. Once we've got everything set up, we are ready to call MPI_Start_log to begin recording events. Next, we simply put the sections of code we want to profile between pairs of calls to MPE_Log_event. For example, the initial MPI_Bcast call is profiled by surrounding it with the MPE_Log_event calls for evnt1a and evnt1b. Once you've got the code instrumented, it is just a matter of compiling it with the appropriate MPE options, running the code, and then examining the logfiles. Here is the display for this program. This is shown in Figure 17-4. Figure 17-4. Timeline In this example, I've opted to display the timeline for the program. For this particular display, I chose MPI-Process under View Options and clicked on the Display button under Frame Operations. (If you try this example, you may find it educational to run it with and without the calls to MPI_Barrier.) |
|
|
Table of Contents |
|