|
|
Table of Contents |
|
16.6 Symbolic DebuggersIf these first two approaches don't seem to be working for you, it's time to turn to a symbolic debugger. (Arguably, the sooner you switch to a symbolic debugger, the better.) Symbolic debuggers will allow you to trace the execution of your program, stop and examine variables, make changes, and resume execution. While you'll need to learn how to use them, most are fairly intuitive and don't take long to master. All you really need to do is learn a few basic commands to get started. You can learn more commands as the need arises. There are a number of symbolic debuggers available, including debuggers that are specifically designed to work with parallel programs such as commercial products like TotalView. With a little extra effort, you'll probably be able to get by with some more common debuggers. In this chapter we'll look at gdb and ddd, first with serial programs and then with parallel programs. gdb is a command-line symbolic debugger from the GNU project. As such, it is freely available. You probably already have it installed on your Linux system. ddd is a GUI frontend that can be used with gdb (or other debuggers) in an X Window System environment.[1] You may need to install ddd, but the process is straightforward and is described in Chapter 9.
16.6.1 gdbTo demonstrate gdb, we'll use the program area.c from Chapter 13 with one slight added error. (Also, the macro for f has been replaced with a function.) Here is the now buggy code: #include <stdio.h>
/* problem parameters */
#define numberSteps 50
#define lowerLimit 2.0
#define upperLimit 5.0
double f(double x)
{
return x*x;
}
int main ( int argc, char * argv[ ] )
{
int i;
double area = 0.0;
double step = (upperLimit - lowerLimit) / numberSteps;
double at, height;
for (i = 0; i <= numberSteps; i--)
{ at = lowerLimit + i * step + step / 2.0;
height = f(at);
area = area + step * height;
}
printf ("The area from %f to %f is: %f\n",
lowerLimit, upperLimit, area );
return 0;
}If you try to run this, it doesn't print anything and doesn't return. With that kind of behavior, it is pretty easy to guess that there is something wrong with the loop. But let's play dumb for a moment and see how we could discover this using gdb. Before you can run gdb with a program, you should compile that program with the -g option. [sloanjd@amy DEBUG]$ gcc -g area.c -o area The -g option generates code that produces debugging information. This is necessary to make the symbol table available so that you can refer to variables by name. Unlike most compilers, gcc will allow you to use an optimization option (-O) with -g. Keep in mind that optimizing code may reorder instructions or may eliminate variables. This can be mind-boggling to a debugger so, in general, you should avoid optimizing your code when you plan to use a symbolic debugger. With gcc, you have some latitude, but beware! Once the code is properly compiled, you can start gdb. There are several ways to do this, but the simplest is to pass the name of the program as a command-line argument. For example, [sloanjd@amy DEBUG]$ gdb -q area (gdb) In this case, the -q option is used to suppress the general information that it prints by default. When the program is loaded and ready to go, it returns the (gdb) prompt. You can get a list of command categories by typing help at the prompt. To see a listing of the commands within a category, type help followed by the category name, for example, help data. Commands may be abbreviated provided the shortened name is unambiguous. For example, append may be shortened to app but not to ap since it would be confused with apropos. The most reasonable place to start is probably the list command (abbreviated l). list will begin listing your program, 10 lines at a time. (gdb) l
7
8 double f(double x)
9 {
10 return x*x;
11 }
12
13 int main ( int argc, char * argv[ ] )
14 {
15 int i;
16 double area = 0.0;If you continue with list, it will display the next 10 lines of code. If you give it a single numeric value, it will list 10 lines starting at that line. If you give it two numeric values separated by a comma, it will treat those values as a range and print that code. For example, (gdb) l 18,20 18 double at, height; 19 20 for (i = 0; i <= numberSteps; i--) If you enter help list at the prompt, you'll see a list of additional ways to use list. Next, let's put a breakpoint on line 20. A breakpoint allows you to start a program and have it automatically stop when it reaches the target line. If the line is never reached, e.g., it is embedded in a conditional statement that fails, then the code won't stop. If the line is executed several times, such as a breakpoint within a loop, it will stop each time. (gdb) b 20 Breakpoint 1 at 0x804836e: file area.c, line 20. You can list breakpoints with the info breakpoint command. Type help b at the prompt to learn more breakpoints and the commands that can be used with them. (gdb also supports watchpoints, which stop when a watched variable changes, and catchpoints, which catch an exception). Now let's run the program. (gdb) run Starting program: /home/sloanjd/DEBUG/area Breakpoint 1, main (argc=1, argv=0xbfffe774) at area.c:20 20 for (i = 0; i <= numberSteps; i-) You'll note that it stopped at our breakpoint as expected. Let's look at a few variables to make sure everything has been initialized correctly. (gdb) print area $1 = 0 (gdb) print step $2 = 0.059999999999999998 So far, everything looks good. (gdb) print numberSteps No symbol "numberSteps" in current context. This may look like a problem, but it isn't. You'll recall that numberSteps isn't a program variable. It was defined with a #define statement. The preprocessor substitutes the value for the name throughout the program before compilation, so we won't be able to look at this with the debugger. That's not a big problem but something you should be aware of. We can step through individual lines of code with the next command. (gdb) n
21 { at = lowerLimit + i * step + step / 2.0;
(gdb) n
22 height = f(at);
(gdb) n
23 area = area + step * height;
(gdb) n
24 for (i = 0; i <= numberSteps; i++)The step command is just like the next command except that next will treat a subroutine call as one instruction while step will enter into the subroutine. We'll come back to step after we have looked at some of the variables. (gdb) print area $3 = 0.24725399999999992 (gdb) print height $4 = 4.1208999999999989 (gdb) print step * height $5 = 0.24725399999999992 Notice that print will handle expressions as well as simple variables, a real convenience. Everything still looks good. Going back to step, here is the second iteration of the loop traced with step. (gdb) s
21 { at = lowerLimit + i * step + step / 2.0;
(gdb) s
22 height = f(at);
(gdb) s
f (x=2.0899999999999999) at area.c:10
10 return x*x;
(gdb) s
11 }
(gdb) s
main (argc=1, argv=0xbfffe774) at area.c:23
23 area = area + step * height;
(gdb) s
20 for (i = 0; i <= numberSteps; i++)Notice that we are diving into the function f. The body of the loop seems to be working correctly. Maybe there is something wrong with the print statement? To examine the values it is getting, we'll set a second breakpoint and resume execution. (gdb) l 25,27
25
26 printf ("The area from %f to %f is: %f\n",
27 lowerLimit, upperLimit, area );
(gdb) b 26
Breakpoint 2 at 0x80483c4: file area.c, line 26.
(gdb) continue
Continuing.At this point the program hangs. Since the body of the loop looks OK and we aren't getting to the printf, there must be something wrong with the loop control structure. Let's interrupt the program (CTRL-C) and examine the counter i. Program received signal SIGINT, Interrupt. 0x0804833d in f (x=-83775291.069999993) at area.c:10 10 return x*x; (gdb) print i No symbol "i" in current context. (gdb) n 11 } (gdb) n main (argc=1, argv=0xbfffd774) at area.c:23 23 area = area + step * height; (gdb) print i $7 = -1396254885 When the program was interrupted, we were in the function f so i was out of scope. We needed to step through a couple of instructions to return to the main program to examine i. And when we did, we saw that something was obviously wrong. We can change the value of i and continue. (gdb) set var i=51
(gdb) continue
Continuing.
Breakpoint 2, main (argc=1, argv=0xbfffd774) at area.c:26
26 printf ("The area from %f to %f is: %f\n",With an appropriate value of i, we exit the loop. Clearly, i isn't being updated appropriately. We can continue until the end now, although our output won't make much sense, and then exit gdb. (gdb) continue Continuing. The area from 2.000000 to 5.000000 is: 203220027199808325287936.000000 Program exited normally. (gdb) q Or we could have just quit where we were. No doubt you noticed that the code had been changed from i++ to i-- long before the end of this section. This is definitely a problem that rereading the code should have found. Nevertheless, you should have an idea of how to use gdb at this point. 16.6.2 dddData Display Debugger is a frontend for command-line debuggers (or inferior debugger, in ddd parlance). We'll use it with gdb, but it is not limited to gdb. You must have the X Window System running. Since ddd is a frontend to gdb and you already know how to use gdb, there isn't much new to learn. But ddd does have a few nice tricks. Although we won't go into it here, one of ddd's real strengths is displaying complex data structures such as linked lists. As with gdb, compile your program with the -g option. Next, open ddd with executable as an argument. [sloanjd@amy DEBUG]$ ddd area A ddd splash screen will appear briefly and then three windows will open. The top window is the ddd Tip of the Day window[2] as shown in Figure 16-1.
Figure 16-1. ddd Tip of the Day #31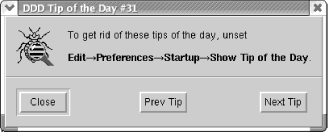 Read the tip, if you like, and then close the window. The large window underneath the tip window is the main window you'll be working from. Off to the side you'll see a smaller window with a few ddd commands. The small command window can be repositioned so that it doesn't overlap with the main window if you wish. Figure 16-2 shows both of these windows. Figure 16-2. ddd's main window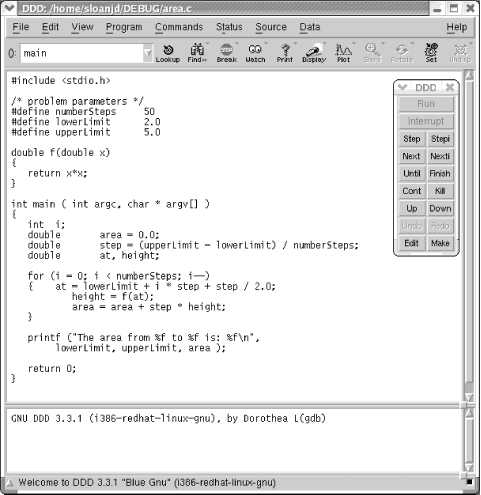 The window is pretty self-explanatory. The upper pane holds your source code, while the lower pane is a text interface to gdb. You can type gdb commands in the lower pane just as you did on the command line. gdb commands are also available via the menus at the top of the window, or you can use the command window to enter the most common commands. For example, if you want to edit the source, you can type edit in the command window (just as you would in gdb) or you can click on the edit button. Either way, you'll be thrown into an editor. (Sorry, you can't edit it directly in the upper pane.) To add a breakpoint, you can select a line in the upper pane and then click on the break button (with the stop sign) on the tool bar. As you step through the code, a large green arrow at the edge of the top pane points to the current line. If you move the cursor over a variable, after a few seconds, a pop-up box will display the variable's current values. The display can be reconfigured if you wish. For example, if you want to look at the machine code in addition to (or instead of) the source listings, you can open a machine language window (and close the source window). You can also resize windows and change fonts to your heart's content. |
|
|
Table of Contents |
|