|
|
Table of Contents |
|
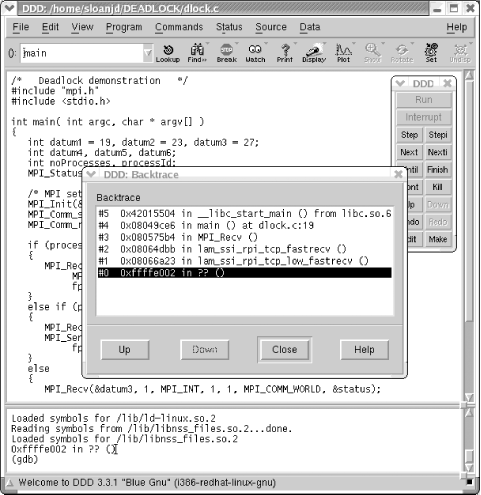
16.7 Using gdb and ddd with MPIThus far we have used the debugger to start the program we want to debug. But with MPI programs, we have used mpirun or mpiexec to start programs, which would seem to present a problem.[3] Fortunately, there is a second way to start gdb or ddd that hasn't been described yet. If a process is already in execution, you can specify its process number and attach gdb or ddd to it. This is the key to using these debuggers with MPI.
With this approach you'll start a parallel application the way you normally do and then attach to it. This means the program is already in execution before you start the debugger. If it is a very short program, then it may finish before you can start the debugger. The easiest way around this is to include an input statement near the beginning. When the program starts, it will pause at the input statement waiting for your reply. You can easily start the debugger before you supply the required input. This will allow you to debug the program from that point. Of course, if the program is hanging at some point, you won't have to be in such a hurry. Seemingly, a second issue is which cluster node to run the debugger on. The answer is "take your pick." You can run the debugger on each machine if you want. You can even run different copies on different machines simultaneously. This should all be clearer with a couple of examples. We'll look at a serial program first-the flawed area program discussed earlier in this chapter. We'll start it running in one window. [sloanjd@amy DEBUG]$ ./area Then, in a second widow, we'll look to see what its process number is. [sloanjd@amy DEBUG]$ ps -aux | grep area sloanjd 19338 82.5 0.1 1340 228 pts/4 R 09:57 0:32 ./area sloanjd 19342 0.0 0.5 3576 632 pts/3 S 09:58 0:00 grep area If it takes you several tries to debug your program, watch out for zombie processes and be sure to kill any extraneous or hung processes when you are done. With this information, we can start a debugger. [sloanjd@amy DEBUG]$ gdb -q area 19338 Attaching to program: /home/sloanjd/DEBUG/area, process 19338 Reading symbols from /lib/tls/libc.so.6...done. Loaded symbols for /lib/tls/libc.so.6 Reading symbols from /lib/ld-linux.so.2...done. Loaded symbols for /lib/ld-linux.so.2 0x080483a1 in main (argc=1, argv=0xbfffe1e4) at area.c:22 22 height = f(at); (gdb) When we attach to it, the program will stop running. It is now under our control. Of course, part of the program will have executed before we attached to it, but we can now proceed with our analysis using commands we have already seen. Let's do the same thing with the deadlock program presented earlier in the chapter. First we'll compile and run it. [sloanjd@amy DEADLOCK]$ mpicc -g dlock.c -o dlock [sloanjd@amy DEADLOCK]$ mpirun -np 3 dlock Notice that the -g option is passed transparently to the compiler. Don't forget to include it. (If you get an error message that the source is not available, you probably forgot.) Then look for the process number and start ddd. [sloanjd@amy DEADLOCK]$ ps -aux | grep dlock sloanjd 19473 0.0 0.5 1600 676 pts/4 S 10:16 0:00 mpirun -np 3 dlock sloanjd 19474 0.0 0.7 1904 904 ? S 10:16 0:00 dlock sloanjd 19475 0.0 0.5 3572 632 pts/3 S 10:17 0:00 grep dlock [sloanjd@amy DEADLOCK]$ ddd dlock 19474 Notice that we see both the mpirun and the actual program. We are interested in the latter. Once ddd is started, we can go to Status Backtrace to see where we are. A backtrace is a list of the functions that called the current one, extending back to the function with which the program began. As you can see in Figure 16-3, we are at line 19, the call to MPI_Recv. Figure 16-3. ddd with Backtrace If you want to see what's happening on another processor, you can use ssh to connect to the machine and repeat the process. You will need to change to the appropriate directory so that the source will be found. Also, of course, the process number will be different so you must check for it again. [sloanjd@amy DEADLOCK]$ ssh oscarnode1 [sloanjd@oscarnode1 sloanjd]$ cd DEADLOCK [sloanjd@oscarnode1 DEADLOCK]$ ps -aux | grep dlock sloanjd 23029 0.0 0.7 1908 896 ? S 10:16 0:00 dlock sloanjd 23107 0.0 0.3 1492 444 pts/2 S 10:39 0:00 grep dlock [sloanjd@oscarnode1 DEADLOCK]$ gdb -q dlock 23029 Attaching to program: /home/sloanjd/DEADLOCK/dlock, process 23029 Reading symbols from /usr/lib/libaio.so.1...done. Loaded symbols for /usr/lib/libaio.so.1 Reading symbols from /lib/libutil.so.1...done. Loaded symbols for /lib/libutil.so.1 Reading symbols from /lib/tls/libpthread.so.0...done. [New Thread 1073927328 (LWP 23029)] Loaded symbols for /lib/tls/libpthread.so.0 Reading symbols from /lib/tls/libc.so.6...done. Loaded symbols for /lib/tls/libc.so.6 Reading symbols from /lib/ld-linux.so.2...done. Loaded symbols for /lib/ld-linux.so.2 Reading symbols from /lib/libnss_files.so.2...done. Loaded symbols for /lib/libnss_files.so.2 0xffffe002 in ?? ( ) (gdb) bt #0 0xffffe002 in ?? ( ) #1 0x08066a23 in lam_ssi_rpi_tcp_low_fastrecv ( ) #2 0x08064dbb in lam_ssi_rpi_tcp_fastrecv ( ) #3 0x080575b4 in MPI_Recv ( ) #4 0x08049d4c in main (argc=1, argv=0xbfffdb44) at dlock.c:25 #5 0x42015504 in _ _libc_start_main ( ) from /lib/tls/libc.so.6 The back trace information is similar. The program is stalled at line 25, the MPI_Recv call for process with rank 1. gdb was used since this is a text-based window. If the node supports X Window System (by default, an OSCAR compute node won't), I could have used ddd by specifying the head node as the display. |
|
|
Table of Contents |
|