There are two major questions that help us link the dynamic model with the static model. The first question is: What objects do we need for each of these use cases? (We'll pose the second question in Chapter 7.) We'll use the robustness analysis technique originally developed by Ivar Jacobson to help answer this question.
A robustness diagram is similar to a UML collaboration diagram, in that it shows the objects that participate in the scenario and how those objects interact with each other. Robustness analysis is not exactly a core part of UML; instead, it requires the use of some stereotypes. Robustness analysis was part of Jacobson's Objectory method; it's an informal, "back of the envelope" kind of analysis that's of enormous value in helping you refine use case text and discover objects that are needed, but that didn't make it into the domain model.
When they built the UML, the three amigos recognized the existence of this technique, but they didn't incorporate it as a core part of the UML standard. Instead, they developed Objectory process-specific extensions. They did this using a UML technique called stereotyping, which allows you to bind custom icons to any kind of symbol. In the case of robustness analysis, stereotypes implement the icons you see on the screen as icons for classes.
Anatomically, a robustness diagram in UML is a class diagram, although Jacobson's original concept was closer to a collaboration diagram, which shows object instances rather than classes. Today, though, it's a class diagram on which, instead of showing the normal UML class symbol, you use three kinds of icons, for three different kinds of objects:
Boundary objects, which actors use in communicating with the system
Entity objects, which are usually objects from the domain model (the subject of Chapter 2)
Control objects (which we usually call controllers because they often aren't real objects), which serve as the "glue" between boundary objects and entity objects
Figure 5-1 shows the visual icons for these three types of objects.

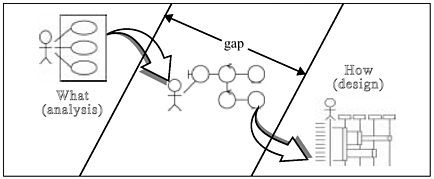
Within the ICONIX process, this simple but highly useful technique serves as a crucial link between analysis (the what) and design (the how), as shown in Figure 5-2.

This diagram explains a lot about why software development, in general, is a hard process. What we're talking about is the need to start from a requirements-level view, where you're thinking only about what your users need to do with the system without considering implementation details, and then driving that view of your system forward into something that's totally focused on design. In this case, on your sequence diagram (see Chapter 7), you're showing precisely how runtime object instances interact with each other as your system is executing. One of the most difficult problems in software development is to get from this "what" view of the world into a "how" view of the world. Robustness analysis is a technique that helps people do this.
At this preliminary design phase, you should start to think through possible alternative design strategies and technical architectures that are going to differ, depending on what technologies you're using to build the system. You're going to start to uncover issues related to system performance. For example, you may find that you have two objects that need to have heavy communication with each other and that these objects are remotely connected across a network. This may have performance implications for your design. During robustness analysis, you'll take your requirements-level use case text and start making some preliminary design assumptions.
It's curious that most of the current body of UML literature doesn't make any mention of this concept. Our experience is that success on your projects and avoiding analysis paralysis is directly linked to using this technique.
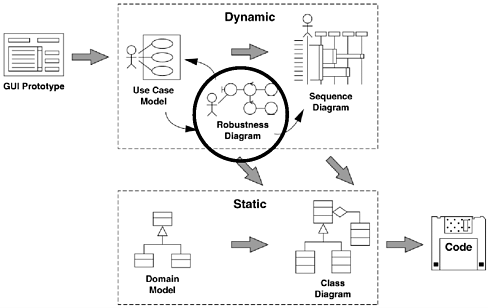
Figure 5-3 shows where robustness analysis resides within the "big picture" for the ICONIX process.
