5.1 (Amdahl's law [Amd67]) If a problem of size W has a serial component WS, prove that W/WS is an upper bound on its speedup, no matter how many processing elements are used.
5.2 (Superlinear speedup) Consider the search tree shown in Figure 5.10(a), in which the dark node represents the solution.
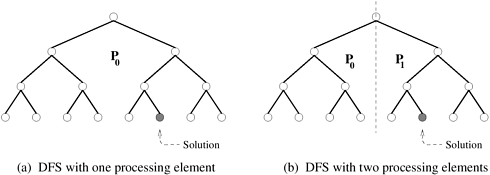
If a sequential search of the tree is performed using the standard depth-first search (DFS) algorithm (Section 11.2.1), how much time does it take to find the solution if traversing each arc of the tree takes one unit of time?
Assume that the tree is partitioned between two processing elements that are assigned to do the search job, as shown in Figure 5.10(b). If both processing elements perform a DFS on their respective halves of the tree, how much time does it take for the solution to be found? What is the speedup? Is there a speedup anomaly? If so, can you explain the anomaly?
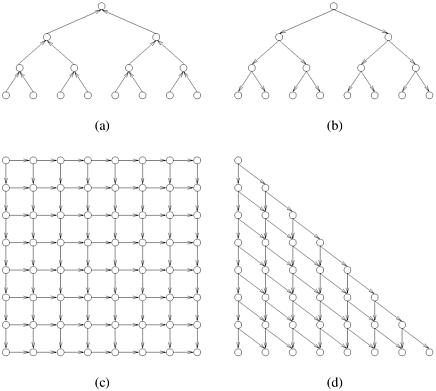
5.3 (The DAG model of parallel computation) Parallel algorithms can often be represented by dependency graphs. Four such dependency graphs are shown in Figure 5.11. If a program can be broken into several tasks, then each node of the graph represents one task. The directed edges of the graph represent the dependencies between the tasks or the order in which they must be performed to yield correct results. A node of the dependency graph can be scheduled for execution as soon as the tasks at all the nodes that have incoming edges to that node have finished execution. For example, in Figure 5.11(b), the nodes on the second level from the root can begin execution only after the task at the root is finished. Any deadlock-free dependency graph must be a directed acyclic graph (DAG); that is, it is devoid of any cycles. All the nodes that are scheduled for execution can be worked on in parallel provided enough processing elements are available. If N is the number of nodes in a graph, and n is an integer, then N = 2n - 1 for graphs (a) and (b), N = n2 for graph (c), and N = n(n + 1)/2 for graph (d) (graphs (a) and (b) are drawn for n = 4 and graphs (c) and (d) are drawn for n = 8). Assuming that each task takes one unit of time and that interprocessor communication time is zero, for the algorithms represented by each of these graphs:
Compute the degree of concurrency.
Compute the maximum possible speedup if an unlimited number of processing elements is available.
Compute the values of speedup, efficiency, and the overhead function if the number of processing elements is (i) the same as the degree of concurrency and (ii) equal to half of the degree of concurrency.
5.4 Consider a parallel system containing p processing elements solving a problem consisting of W units of work. Prove that if the isoefficiency function of the system is worse (greater) than Q(p), then the problem cannot be solved cost-optimally with p = (W). Also prove the converse that if the problem can be solved cost-optimally only for p < Q(W), then the isoefficiency function of the parallel system is worse than linear.
5.5 (Scaled speedup) Scaled speedup is defined as the speedup obtained when the problem size is increased linearly with the number of processing elements; that is, if W is chosen as a base problem size for a single processing element, then
Equation 5.37
For the problem of adding n numbers on p processing elements (Example 5.1), plot the speedup curves, assuming that the base problem for p = 1 is that of adding 256 numbers. Use p = 1, 4, 16, 64, and 256. Assume that it takes 10 time units to communicate a number between two processing elements, and that it takes one unit of time to add two numbers. Now plot the standard speedup curve for the base problem size and compare it with the scaled speedup curve.
Hint: The parallel runtime is (n/p - 1) + 11 log p.
5.6 Plot a third speedup curve for Problem 5.5, in which the problem size is scaled up according to the isoefficiency function, which is Q(p log p). Use the same expression for TP .
Hint: The scaled speedup under this method of scaling is given by the following equation:
5.7 Plot the efficiency curves for the problem of adding n numbers on p processing elements corresponding to the standard speedup curve (Problem 5.5), the scaled speedup curve (Problem 5.5), and the speedup curve when the problem size is increased according to the isoefficiency function (Problem 5.6).
5.8 A drawback of increasing the number of processing elements without increasing the total workload is that the speedup does not increase linearly with the number of processing elements, and the efficiency drops monotonically. Based on your experience with Problems 5.5 and 5.7, discuss whether or not scaled speedup increases linearly with the number of processing elements in general. What can you say about the isoefficiency function of a parallel system whose scaled speedup curve matches the speedup curve determined by increasing the problem size according to the isoefficiency function?
5.9 (Time-constrained scaling) Using the expression for TP from Problem 5.5 for p = 1, 4, 16, 64, 256, 1024, and 4096, what is the largest problem that can be solved if the total execution time is not to exceed 512 time units? In general, is it possible to solve an arbitrarily large problem in a fixed amount of time, provided that an unlimited number of processing elements is available? Why?
5.10 (Prefix sums) Consider the problem of computing the prefix sums (Example 5.1) of n numbers on n processing elements. What is the parallel runtime, speedup, and efficiency of this algorithm? Assume that adding two numbers takes one unit of time and that communicating one number between two processing elements takes 10 units of time. Is the algorithm cost-optimal?
5.11 Design a cost-optimal version of the prefix sums algorithm (Problem 5.10) for computing all prefix-sums of n numbers on p processing elements where p < n. Assuming that adding two numbers takes one unit of time and that communicating one number between two processing elements takes 10 units of time, derive expressions for TP , S, E , cost, and the isoefficiency function.
5.12 [GK93a] Prove that if To  (p) for a given problem size, then the parallel execution time will continue to decrease as p is increased and will asymptotically approach a constant value. Also prove that if To > Q(p), then TP first decreases and then increases with p; hence, it has a distinct minimum.
5.13 The parallel runtime of a parallel implementation of the FFT algorithm with p processing elements is given by TP = (n/p) log n + tw(n/p) log p for an input sequence of length n (Equation 13.4 with ts = 0). The maximum number of processing elements that the algorithm can use for an n-point FFT is n. What are the values of p0 (the value of p that satisfies Equation 5.21) and  for tw = 10?
5.14 [GK93a] Consider two parallel systems with the same overhead function, but with different degrees of concurrency. Let the overhead function of both parallel systems be W 1/3 p3/2 + 0.1W 2/3 p. Plot the TP versus p curve for W = 106, and 1 p 2048. If the degree of concurrency is W1/3 for the first algorithm and W2/3 for the second algorithm, compute the values of for both parallel systems. Also compute the cost and efficiency for both the parallel systems at the point on the TP versus p curve where their respective minimum runtimes are achieved.